Capital Investments in Beauty and Cosmetics: Market Overview

Capital Investments in Beauty and Cosmetics: Market Overview

The global cosmetic and beauty market is anticipated to grow to $416 billion in 2028 with a CAGR of 7%. Although the COVID-19 pandemic had a significant negative impact during 2019 and 2020 on the market, the rise in CAGR is attributable to a strong rebound in consumer demand. The market exhibited lower growth of -11% and contracted in 2020, but grew to $254 billion in 2021. This shows that the market has constant demand and is returning to the pre-pandemic level as the effects of the pandemic decrease.

In this report, J&A will analyze the international capital market activity conducted within the beauty and cosmetics market between 2020 and 2022.

Market Overview

The beauty and cosmetics industry are segmented into three major categories: skin care, hair care, and makeup.

  • Skin care forms the largest segment of the cosmetics market with 34%. According to research, the average spend on skin care per person per year is over $1,200 USD in the USA.
  • Hair care maintained a market position of 23%, mostly due to younger consumers. The hair care segment is expected to grow with a CAGR of 6%.
  • The other segments of beauty and cosmetics include hygiene, oral care, and fragrance products with a combined 34% market share.
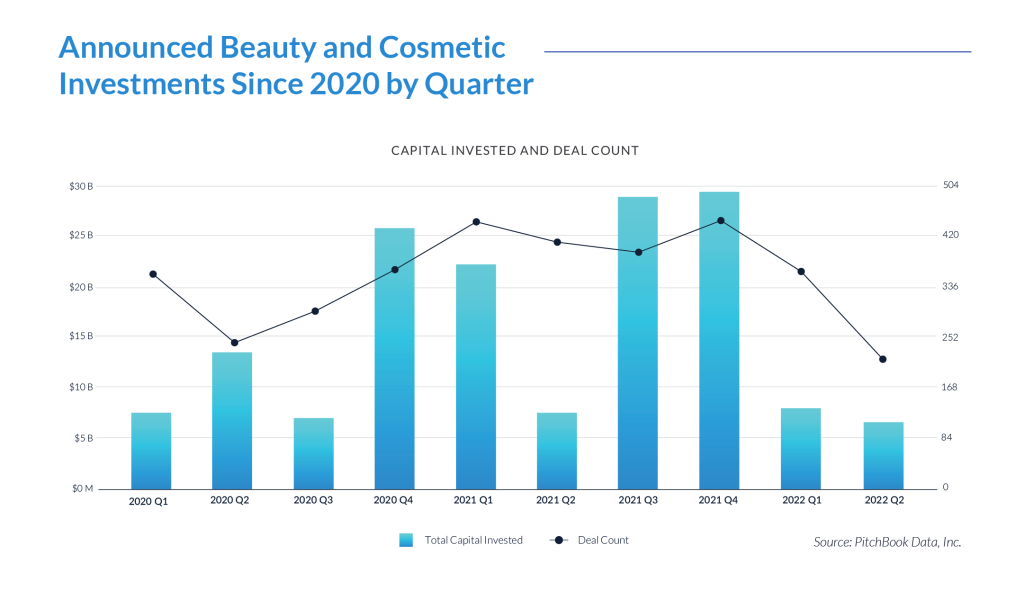
  • In 2020, a focus on beauty and cosmetics (due to the global COVID-19 pandemic) led to a spike in deal flow in the sector, especially in the Q4 time period with $26 billion in capital investments and 390 deals. The total average deal size in 2020 was $174 million.
  • In 2021 Q4 the largest deal was $29 billion, and a total of 430 deals were recorded.
  • In 2021 the average deal size was recorded at $201 million, which shows that the average deal size has increased significantly compared to 2020 when it was recorded at $173 million.
  • Between 2020 and 2022 Q2, 3,348 total deals deployed capital into the beauty and cosmetics market with $154 billion of capital deployed. The average deal size in the sector was $16 billion within that time frame.
  • The periods with the largest amount of capital invested were 2021 Q4 and 2022 Q1, due to the significant market growth with the global COVID-19 pandemic.
  • Jahani and Associates (J&A) anticipate that trend will continue to grow with notable increases in 2022 and forward.
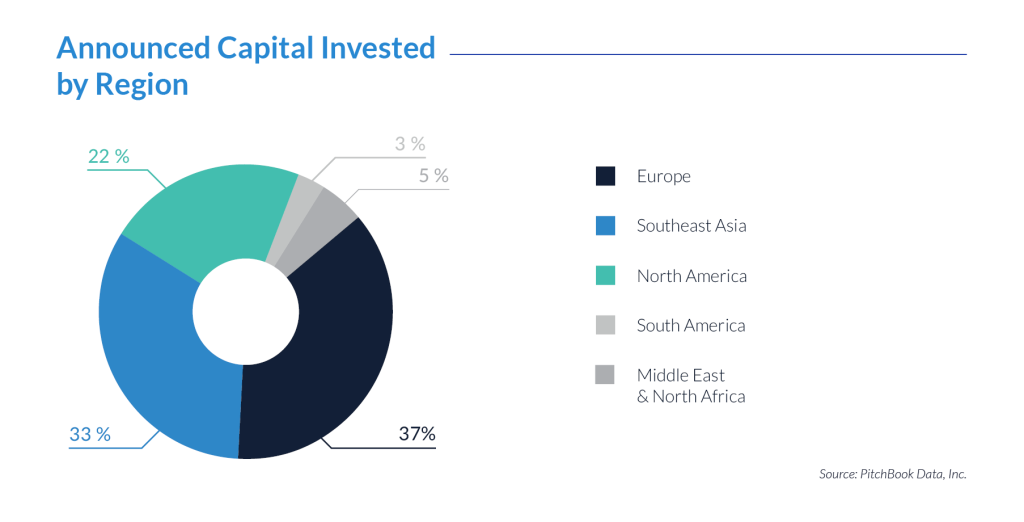
  • Europe is leading the capital invested with 37% of the total raise. The beauty and cosmetics market is growing in the European market mostly. The scalability of the e-commerce market combined with the global pandemic effect on social media directly affected beauty and cosmetics products.
  • Asia has the second-largest capital investment with 33%. Additionally, China and Japan have the largest market size with $52 billion and $38 billion respectively. The technological research and developments in the specific market have grown respectively in the Asian region.
  • Due to their high-end quality of the products, the Korean market has an important place in the global market. In 2019, the market size was estimated at $10 billion. Korea is one of the top 10 beauty markets in the world and has 3% of the global market.
  • The USA holds 22% of the capital investments. The USA currently is the world’s largest beauty market, with about 20% share, followed by China at 13% and Japan at 8%.
  • South America has 3% of the capital investments and the market holds significant growth.
There is considerable growth in the beauty and cosmetics sector and also in the capital market between 2020 Q4 and 2021 Q4. The development of new technologies in the beauty and cosmetics industry has disrupted the existing ecosystem, and technological innovations are projected to significantly impact market growth in the USA and Korean regions in the beauty and cosmetic sectors. The 14% growth in the global e-commerce market makes beauty and cosmetics products more attractive, and the market more scalable for investments. J&A predicts a continued increase in capital market activity within the beauty and cosmetics sector in Southeast Asia and North America as economies become more interconnected and companies expand into new international markets.

Sources: Pitchbook Data, Inc.


How Will the US Economic Downturn Affect M&A Activity?

How Will the US Economic Downturn Affect M&A Activity?

Real GDP in the USA decreased by 0.9% in Q2 of 2022 according to the Bureau of Economic Analysis. This follows a 1.6% decrease in 2022 Q1, resulting in the USA economy falling into recession. The USA is not alone, with developed nations like Germany, Japan, and an array of others experiencing similar contractions according to Reuters.com. The global economy has been impacted by numerous exogenous shocks over the past 30 months, including lockdowns, supply chain crises, stimulus packages, and oil price hikes among others.

The economic conditions will undoubtedly affect capital markets, but the outcome remains uncertain. The reduction in liquidity could shrink capital market activity. Alternatively, a slowing business cycle could result in a buyer’s market, allowing for aggressive consolidation and roll-up strategies. This article will investigate the difference in capital market activity between 2021 H1 and 2022 H2 to determine the effects of the downturn in Western markets.

Why the USA Remains Critical to Capital Markets

  • The USA has contributed 64% of capital deployed in M&A deals since 2020, with a total spend of $4.33 trillion. Businesses in the UK, France, and Japan conducted significant M&A deals within the period with 10%, 5%, and 3% of capital deployed, respectively.
  • Over the same period, 22,178 announced deals have been conducted by companies from the USA.
  • The economic downturn in the USA and major Western economies will impact capital markets in 2022 and beyond.
  • Capital deployed in M&A deals globally increased by 67% from 2021 H1 ($1.15 trillion) to 2022 H2 ($1.91 trillion). Deal count within the period has remained stagnant with a 3%decrease between 2021 H1 (12,692 M&A transactions) and 2022 H1 (12,302 M&A transactions).
  • Median deal size increased from $19 million and $24 million in 2021 Q1 and Q2, respectively, to $31 million and $43 million in 2022 Q1 and Q2, respectively.
  • The highlights an increased appetite for acquisition despite economic downturns, as role-up strategics become increasingly aggressive leading to larger deal sizes. Challenging business conditions would drive the supply side demand while lower valuation would lead to an increase in demand for acquisitions.
  • Capital deployed in cross-border M&A deals by USA-based companies increased by 59% from 2021 H1 ($69 billion) to 2022 H2 ($169 billion). Deal count grew consistently by a 13% increase between 2021 H1 (706 M&A transactions) and 2022 H1 (813 M&A transactions).
  • Median deal size increased from $53 million and $46 million in 2021 Q1 and Q2, respectively, to $70 million and $150 million in 2022 Q1 and Q2, respectively.
  • The data suggest significant growth in cross-border M&A activity by USA-based companies. The degree of competition in domestic markets as well as more affordable valuations in international markets will continue to drive future cross-border transactions.
M&A in the first half of 2022 has grown significantly, with a 67% increase on 2021 capital deployment in the sector over the same time period. The true effects of a recession remain unknown. The data suggest that firms have capitalized on lower valuation multiples and challenging economic conditions to execute inorganic growth strategies. Retained profits achieved in 2021 are likely to be used to execute acquisitions. Liquidity within the market will continue to shrink as global monetary policies tighten, so it is uncertain whether the surge in M&A activity will continue. Current economic conditions present the ideal buyer’s M&A market.

Sources: www.bea.gov/data/gdp/gross-domestic-product, reuters.com/markets/europe/global-markets-recession-risk-2022-07-28, Pitchbook Data.


Global Vertical Farming Market

Global Vertical Farming Market

Vertical farming is an agricultural method to grow crops in vertically stacked layers. It incorporates controlled environment agriculture using soilless farming techniques, which provides better food quality with higher crop yields.

The COVID-19 pandemic and global geopolitical factors have impacted the food and agriculture sector, from supply chain disruption to shortage of food supplies. This has led many to adopt vertical farming technologies, to improve food security and increase farming capacity in urban and local environments. These major factors are contributing to the growth of this market, with a remarkable interest among investors to invest in vertical farms.

Overview of the Vertical Farming Industry

The global vertical farming industry is expected to grow from $3 billion in 2021 to $4 billion in 2022. Further, the market is forecast to grow at a compound annual growth rate (CAGR) of 26% to $21 billion by 2029. With the increase in population and the rise in demand for healthy and safe food, farmers are tending to use new methods and technologies in the agriculture industry, known as vertical farming. This report outlines announced investments made globally in vertical farm deals between 2017 and 2022.


Key Subsectors of the Vertical Farming Industry

Key Subsectors of the Vertical Farming Industry

1 – The Methodologies Of Vertical Farming

Vertical farming methodologies can be divided into hydroponics, aeroponics, and aquaponics based on the use of soil and water in the agricultural process. Farmers can have total control over a hydroponic system by using water more efficiently and improving the quality and taste of the produce. These and many other reasons are driving hydroponics to grow as a vertical farming methodology. Aeroponics leverages air to grow crops. Aquaponics is a method of growing plants and raising fish in water. Fish will feed the plants with their waste that converts into nitrates, and the plants will clean and filter the water before it returns to the fish tank.

2 – Structure Analysis

New and abandoned buildings are being used to deploy and develop vertical farms. Building-based vertical farms are growing across cities. For example, the NYC farming company Bowery Farming developed urban farms inside abandoned warehouses that provide fresh produce to local retailers and restaurants. The shipping container-based structure of vertical farming is projected to gain traction and growth in the coming years. These structures are used for developing indoor farms by controlling and monitoring all systems remotely from a computer or smartphone.

3 – Component Analysis

Various manufacturing components are used within vertical farming processes. LED lighting is becoming ideal for farms for its low operational cost and power consumption. This component, along with climate control, sensors, irrigations, and fertigation components, are driving the segment to grow rapidly and steadily.

Global Capital Market Activity Overview

  • Between 2017 and 2022, $14 billion was deployed across a total of 1,520 vertical farming deals in the analyzed period with an average deal size of $9 million during this period.
  • More than $660 million was deployed into 221 deals within the vertical farm sector in 2017, with an average deal size of $3 million.
  • The COVID-19 pandemic boosted investments in the vertical farms market between 2020 and 2021. The most active year for vertical farming has been 2021, with $6 billion deployed across a total of 332 deal counts and an average deal size of $17 million.

Announced Vertical Farming Deal Counts

  • Approximately 72% of deal counts were attributed to small deal sizes up to $5 million. This indicates the availability of a remarkable number of different start-ups and innovative technologies.
  • The deal sizes ranging from $5 million to $25 million own 18% of the total deal count. Compared to small deal sizes, these growth-stage companies indicate that there are many start-ups doing well in the market and gaining traction.
  • The lowest share of deal count goes to over $25 million deal sizes. This shows that the market is still fragmented with relatively few mature players.
  • The USA is leading the majority of deal counts in the vertical farming market with a 48% share of the global deal counts. This indicates the high presence of many vertical farms across the USA and the adoption of new technologies. The legalization of cannabis in the USA has also helped in the growth of the vertical farming market.
  • Europe holds second place for the highest deal count with 29% of the global count. This region is projected to drive the development of vertical farms in the upcoming years.
  • The Asia Pacific region, with 17% of the deal count, will continue to grow due to the scarcity of water and increased food demand for the vast population like in China and India. Climate change and the financial challenges that the farmers in this region face will drive the need for the adoption of vertical farming techniques.
  • The Middle East and Africa showcase the lowest count of deals with 6%. This region is expected to have remarkable growth in the future due to the rise of water scarcity and the growing research and development activities by market players to boost the development of advanced farming techniques.
With the increase in population and the shift in the global food market to healthier and safer products, farmers are adopting new technologies and farming methods. In contrast to the traditional agriculture methods, these new methods known as vertical farming are a game-changer for the agriculture technology industry. The rise of this global trend is leading to a continuous spike in interest among investors like venture capitalist firms to invest in vertical farms and drive the markets’ growth in the upcoming years.

Sources: Pitchbook Data.


International Investments in Health and Wellness

International Investments in Health and Wellness

Capital market activity within the health and wellness market has expanded by 633% from 2020 Q1 to 2022 Q1. The health and wellness industry includes all activities that promote physical and mental wellbeing, from yoga to healthy eating, personal care and beauty, nutrition and weight loss, meditation, spa retreats, workplace wellness, and wellness tourism. The market has experienced rapid growth since the global COVID-19 pandemic in 2020, highlighting the importance of mental, spiritual, and physical well-being.

The pandemic also highlighted the significance of good living behaviors like improved nutrition, going to the gym, practicing yoga, and stress reduction. The healthy eating, nutrition, and weight reduction market is the second largest, accounting for almost 20% of total revenue. Furthermore, the health and wellness industry have the greatest worldwide expansion potential. Given these considerations, the health and wellness industry appear to be the most promising investment opportunity throughout the forecasted period.
In this report, J&A analyzes the international capital market activity conducted within the health and wellness market between 2011 and 2022.

Overview of the Health and Wellness Market

  • The medical technology sector experienced the greatest capital deployment within the health and wellness sector of over $13 billion in the period. This shows the importance of the industry and raises the demand for tailored industries in the health sector.
  • The applications software development sector received the second-largest capital deployment, with $9 billion.
  • Care services had a significant percentage of capital raised during this period, with $7 billion. This indicates the constant growth of the mental health sector in the forecasted time.


Health and Wellness Industry Market Trends

1 – Clean and Healthy Eating

Consumers are more concerned with living longer and better lives. Consumer preferences have evolved toward eating more natural, organic food that is free of additives and preservatives. Today, eating clean is directly related to a gluten-free, dairy-free, non-refined carbohydrate, and sugar-free diet. The global gluten-free retail sector is expected to increase at a 9% annual rate from 2017 to $12 billion by 2024.

2 – Increasing Demand for Wellness Tourism

Wellness vacations account for 17% of total tourism spending. Increasingly travelers are visiting the Asia-Pacific region, Latin America and the Caribbean, the Middle East, and Africa to get in shape and return home calm and collected. The wellness tourism market is worth $639 billion and growing at a 7% annual rate from 2015 to 2017. Wellness travel is expanding twice as fast as the total tourism growth rate of 3%.

3 – Personalized Technology of Health and Wellness

Smart watches, health and fitness trackers, heart rate monitors, apps that help users’ emotional and mental health, and virtual assistants have all seen an increase in popularity. Wearable technologies are expected to help people live 70% longer, maintain a 63% more healthy life, and pay 62% less in insurance premiums. By 2022, the wearables market is estimated to reach $27 billion.

Announced Health and Wellness Investments Since 2020

  • Between 2020 and 2022, 3,000 investors deployed capital into the health and wellness market. In that time frame, 4,000 deals were deployed by 4,206 investors in the health and wellness sector.
  • In 2020, a focus on health and wellness (due to the global COVID-19 pandemic) led to a spike in deal flow in the sector. The largest deal was calculated at $17 billion, with a total of $146 billion in capital invested.
  • Jahani and Associates (J&A) anticipate that trend will continue to grow with notable increases in 2022 and forward.

Announced Health and Wellness Capital Markets Deals

  • The USA is leading the capital raising with 72% of the total raise. Additionally, the USA has the largest market size in the health and wellness industry at $53 billion in value.
  • Brazil has the second-largest capital raise share, with 8% and Sweden holds the third-largest capital raise share, with 3%. In general, Southeast Asia, the Middle East, Europe, the Gulf Cooperation Council, and Australia are experiencing increasing volume in their capital markets.
  • 48% of capital raised within the sector was deployed into privately held entities, which shows the growth potential of the market and the emergence of new competitors in the sector.
  • An additional 13% of deals done within the health and wellness industry were PIPE, private placements into publicly enterprises, and transactions.
  • In the health and wellness sector, 33% of capital deployed was put into mergers and acquisitions. This indicates that there are large firms that are interested in market consolidation.
  • Less than 1% of capital deployed in the sector was done through IPOs, which shows a lack of maturity within the sector.

Investor Spotlight: Shore Capital Partners

The Company

Shore Capital Partners is a private equity firm based in Chicago, Illinois, founded in 2009. The firm prefers to invest in growth-stage companies through buyouts and seeks to invest in business products, business services, consumer products, consumer services, materials, resources, healthcare, life sciences, oncology, manufacturing, and technology-based sectors in North America.

Website: www.shorecp.com

The health and wellness industry globally has moved its portfolio towards mindfulness and personal care health and well-being. Health and fitness companies in North America dominate capital markets and have raised significantly more capital than the Middle East, Southeast Asian, and European competitors. J&A predicts a continued increase in capital market activity within the sportswear sector as economies become more interconnected and companies expand into new international markets.

Sources: PitchBook, UL, Forbes, CbInsights, Medium, PolicyAdvice, McKinsey.


Privacy Settings
We use cookies to enhance your experience while using our website. If you are using our Services via a browser you can restrict, block or remove cookies through your web browser settings. We also use content and scripts from third parties that may use tracking technologies. You can selectively provide your consent below to allow such third party embeds. For complete information about the cookies we use, data we collect and how we process them, please check our Privacy Policy
Youtube
Consent to display content from Youtube
Vimeo
Consent to display content from Vimeo
Google Maps
Consent to display content from Google

HAVE A 15 MINUTE NETWORKING CALL WITH US

JAHANI&ASSOCIATES