Energy and Infrastructure Staffing and Workforce Solutions Sector M&A Transactions and Valuations

From Q1 2021 through Q4 2025, sustained capital deployment across energy transition, infrastructure development, and industrial expansion drove robust M&A activity within the energy and infrastructure staffing and workforce solutions sector. As project complexity increased and labor availability tightened, workforce solutions providers evolved from transactional staffing intermediaries into critical partners embedded within project execution and operational delivery. Demand for skilled engineering, technical, and craft labor across energy, renewables, and infrastructure markets has elevated the strategic importance of platforms capable of sourcing, deploying, and managing talent across large-scale, multi-region projects.
End markets, particularly within energy and infrastructure, face ongoing challenges related to labor shortages, geographic workforce deployment, and the need for specialized technical expertise across multi-site and cross-border projects. As a result, staffing platforms and workforce solutions providers have become essential partners, offering recruitment, contractor management, and project-based labor solutions that support execution at scale. These platforms range from globally integrated workforce solutions providers to regionally focused skilled trades specialists, all benefiting from recurring workforce utilization, long-term client relationships, and exposure to non-discretionary project activity.
This report analyzes M&A activity and valuation dynamics across the sector, including transaction trends, deal structure, capital deployment patterns, valuation benchmarks, and representative case studies that highlight ongoing consolidation and platform formation within the global workforce solutions landscape supporting energy and infrastructure markets.

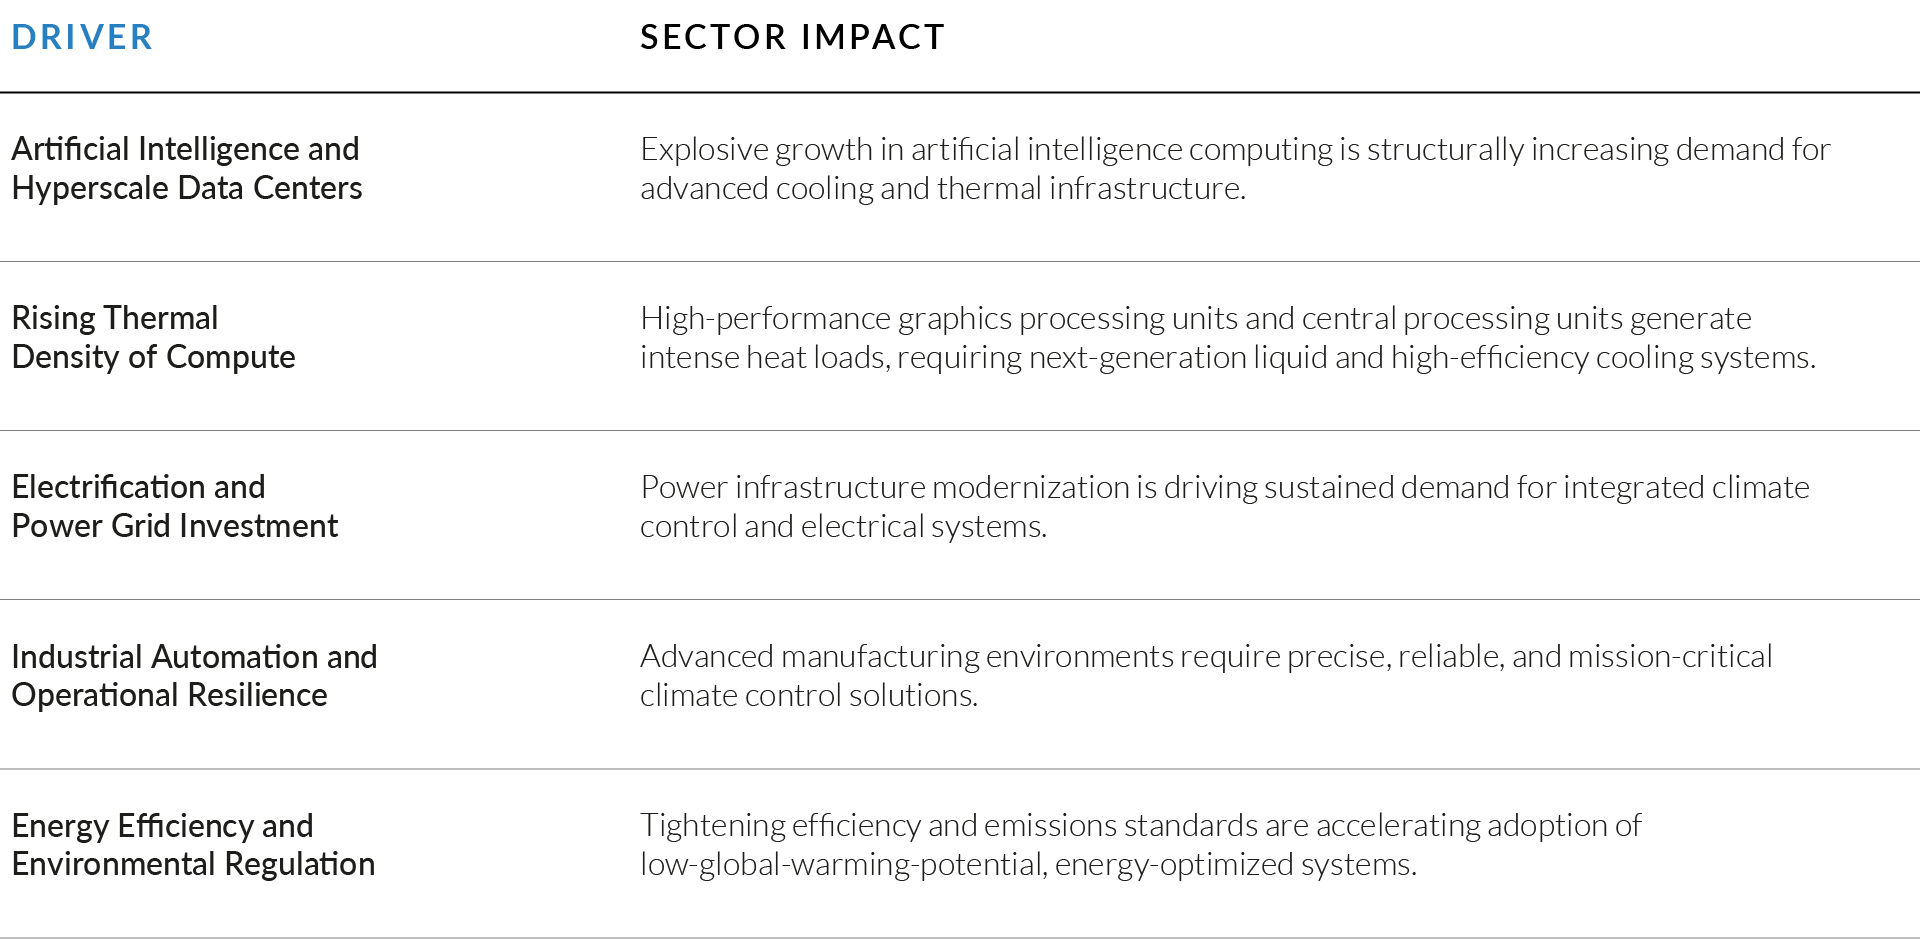
EXHIBIT 1
Structural Demand Drivers in the Energy and Infrastructure Staffing and Workforce Solutions Sector
- Infrastructure Investment and Energy Transition Supporting Workforce Demand:
Long-term capital deployment across infrastructure development, energy transition initiatives, and utility modernization is driving sustained demand for skilled labor across engineering, technical, and field-based roles. Large-scale, multi-year projects require consistent workforce deployment, supporting demand for outsourced staffing and workforce solutions providers. - Reshoring and Industrial Expansion Increasing Labor Intensity:
The reshoring of manufacturing and expansion of domestic industrial capacity are increasing demand for specialized labor, particularly across construction, maintenance, and project-based roles. These dynamics are contributing to sustained workforce requirements across energy, utilities, and infrastructure end markets. - Structural Shortages of Skilled Technical and Field Labor:
Persistent shortages across skilled trades, engineers, and technical specialists continue to constrain internal hiring capabilities, increasing reliance on third-party staffing providers. Labor scarcity is particularly acute in high-skill and operationally critical roles, reinforcing the value of specialized workforce solutions platforms. - Aging Workforce and Demographic Pressures:
Demographic trends, including an aging labor force and the retirement of experienced workers, are tightening labor supply across industrial and energy sectors. This is driving increased demand for recruitment, workforce planning, and talent pipeline solutions. - Defense and Government Spending as an Incremental Demand Catalyst:
Rising defense budgets and government-backed infrastructure initiatives are expanding demand for specialized labor, particularly in security-cleared, engineering, and project execution roles. These dynamics provide revenue visibility and support forward growth expectations for workforce solutions providers serving regulated and government-linked end markets.
Source: William Blair Human Capital Services conference materials and industry analysis; Bureau of Labor Statistics (BLS) labor market data; defense and infrastructure spending outlook publications; industry research on skilled labor shortages and demographic trends.
EXHIBIT 2
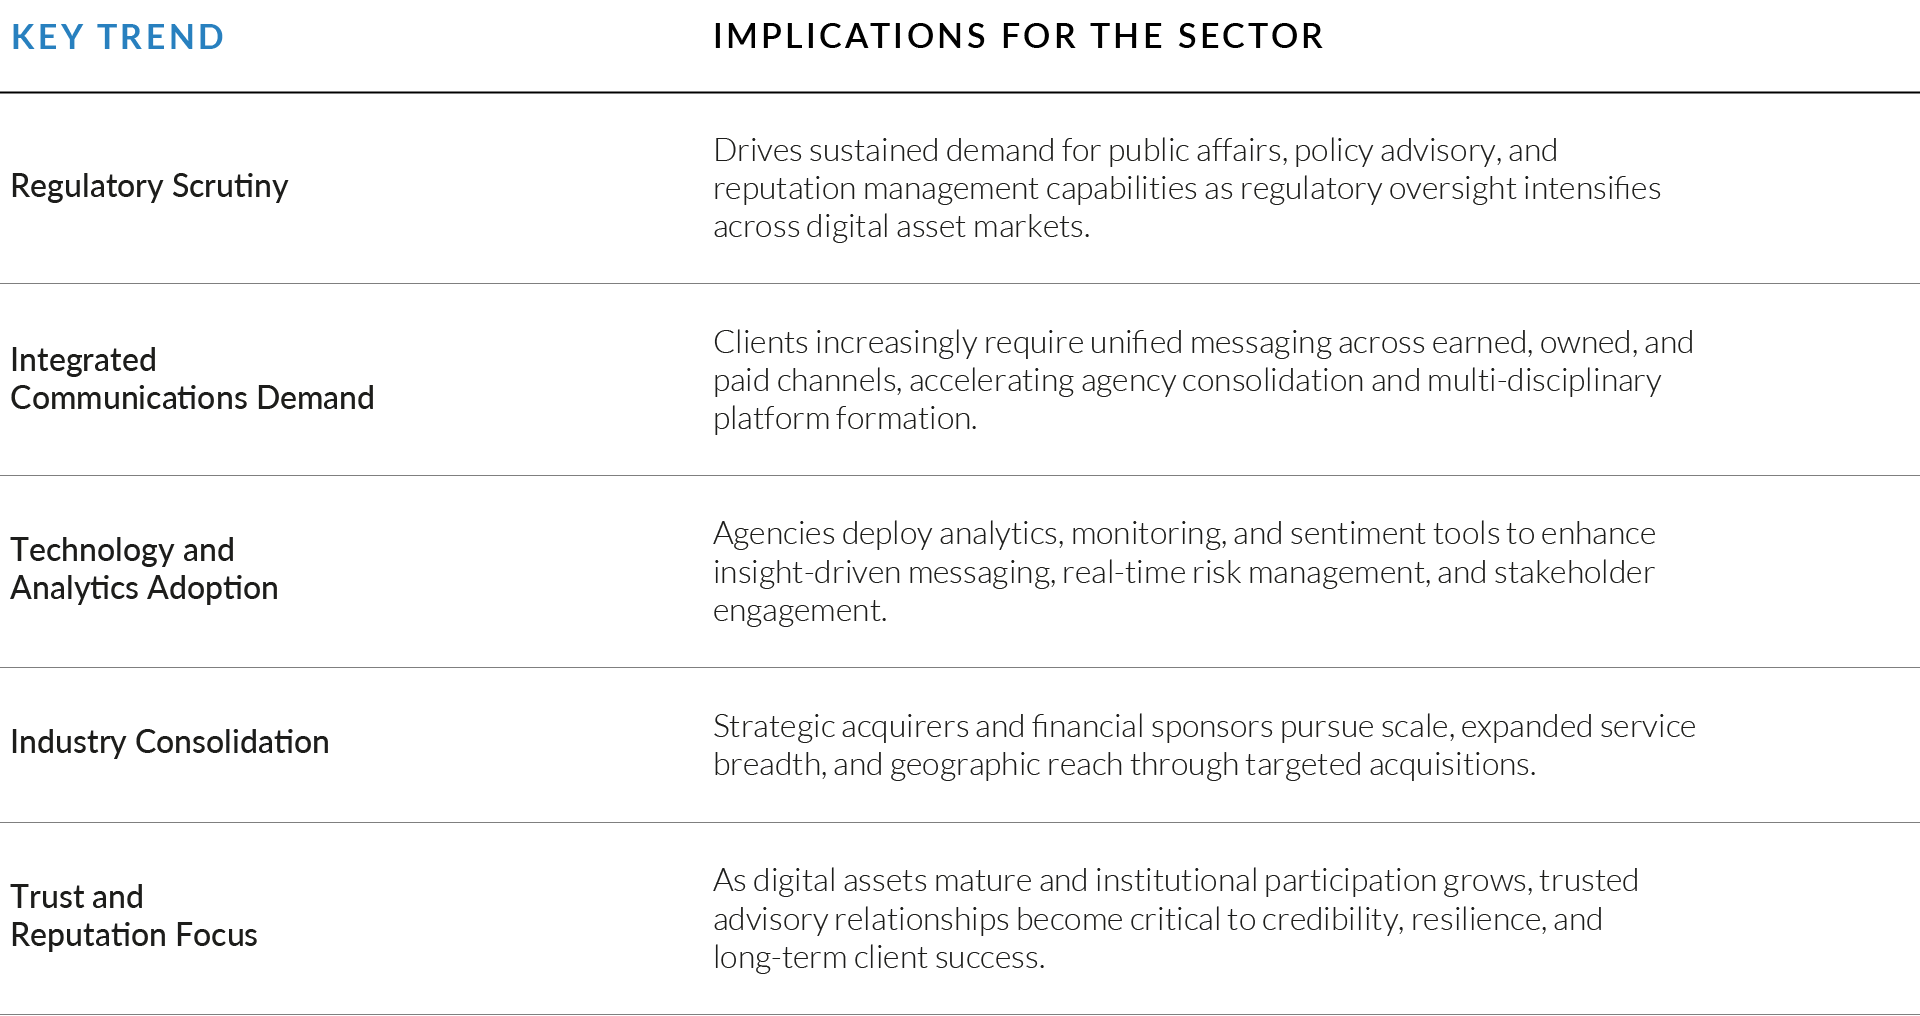
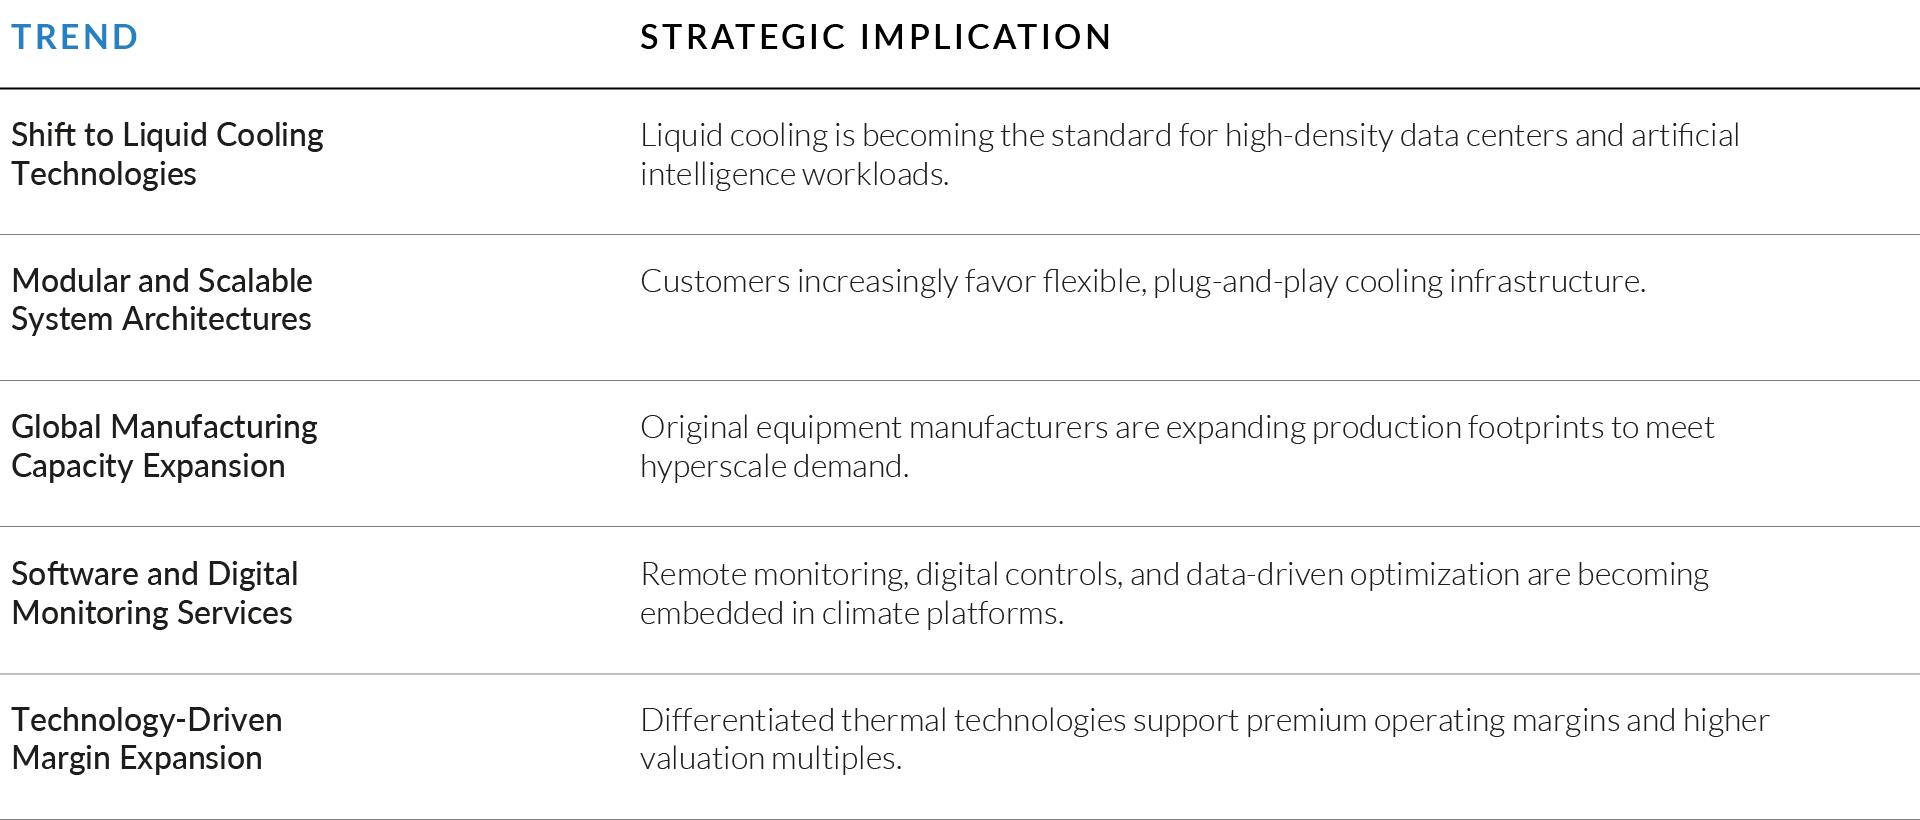
Key Industry Trends in the Energy and Infrastructure Workforce Solutions Sector
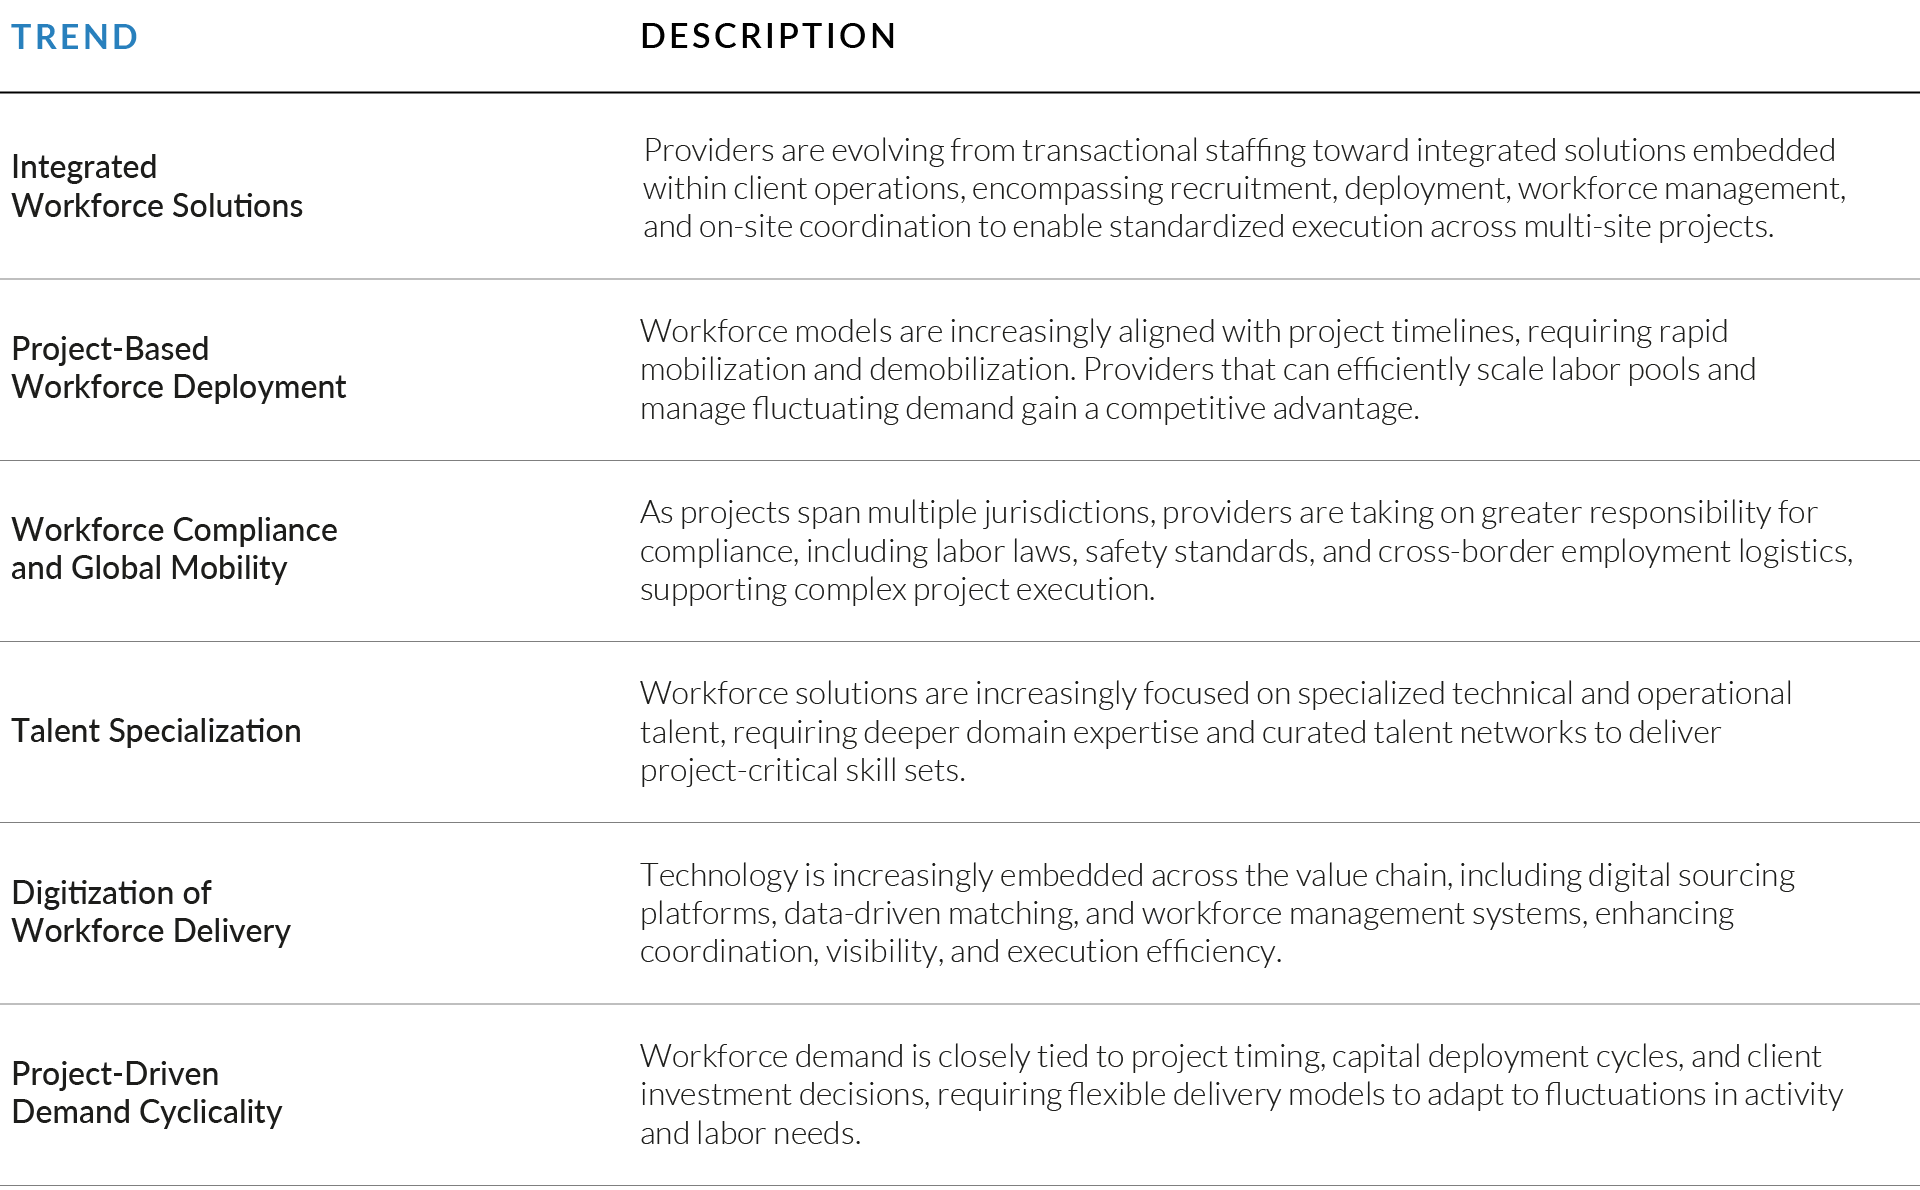
Source: William Blair Human Capital Services conference materials and industry analysis; Bureau of Labor Statistics (BLS) labor market data; defense and infrastructure spending outlook publications; industry research on skilled labor shortages and demographic trends.
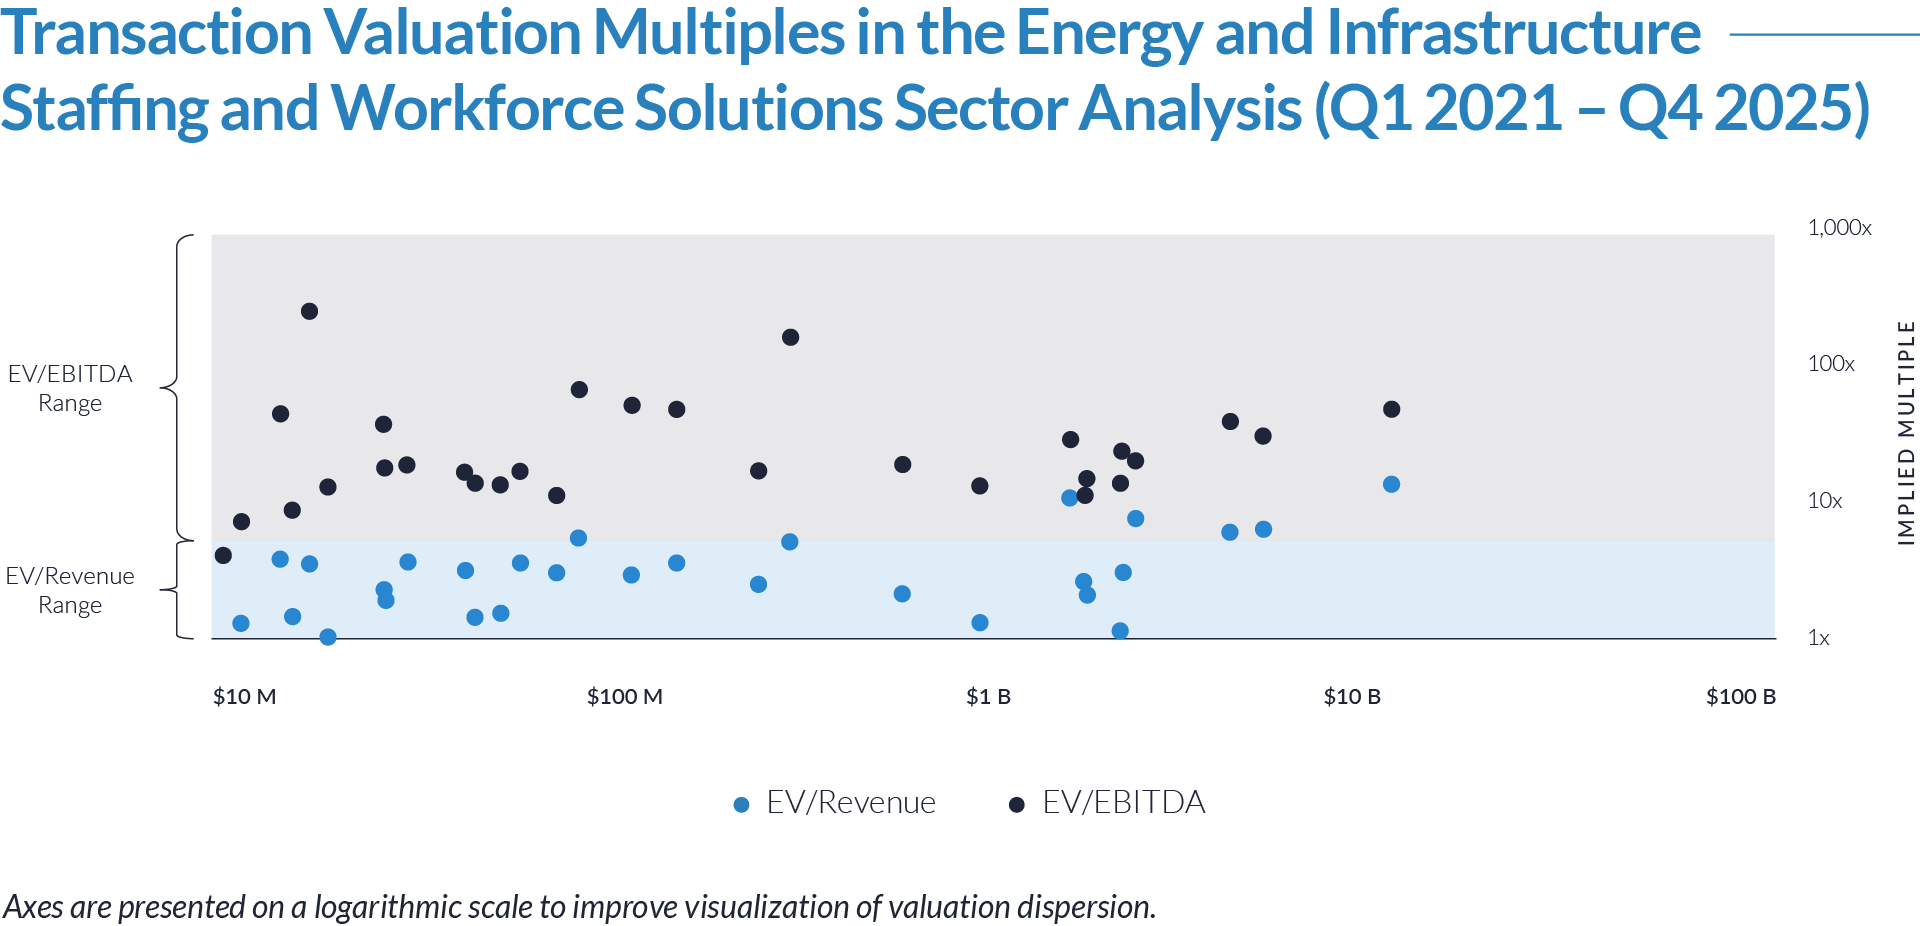
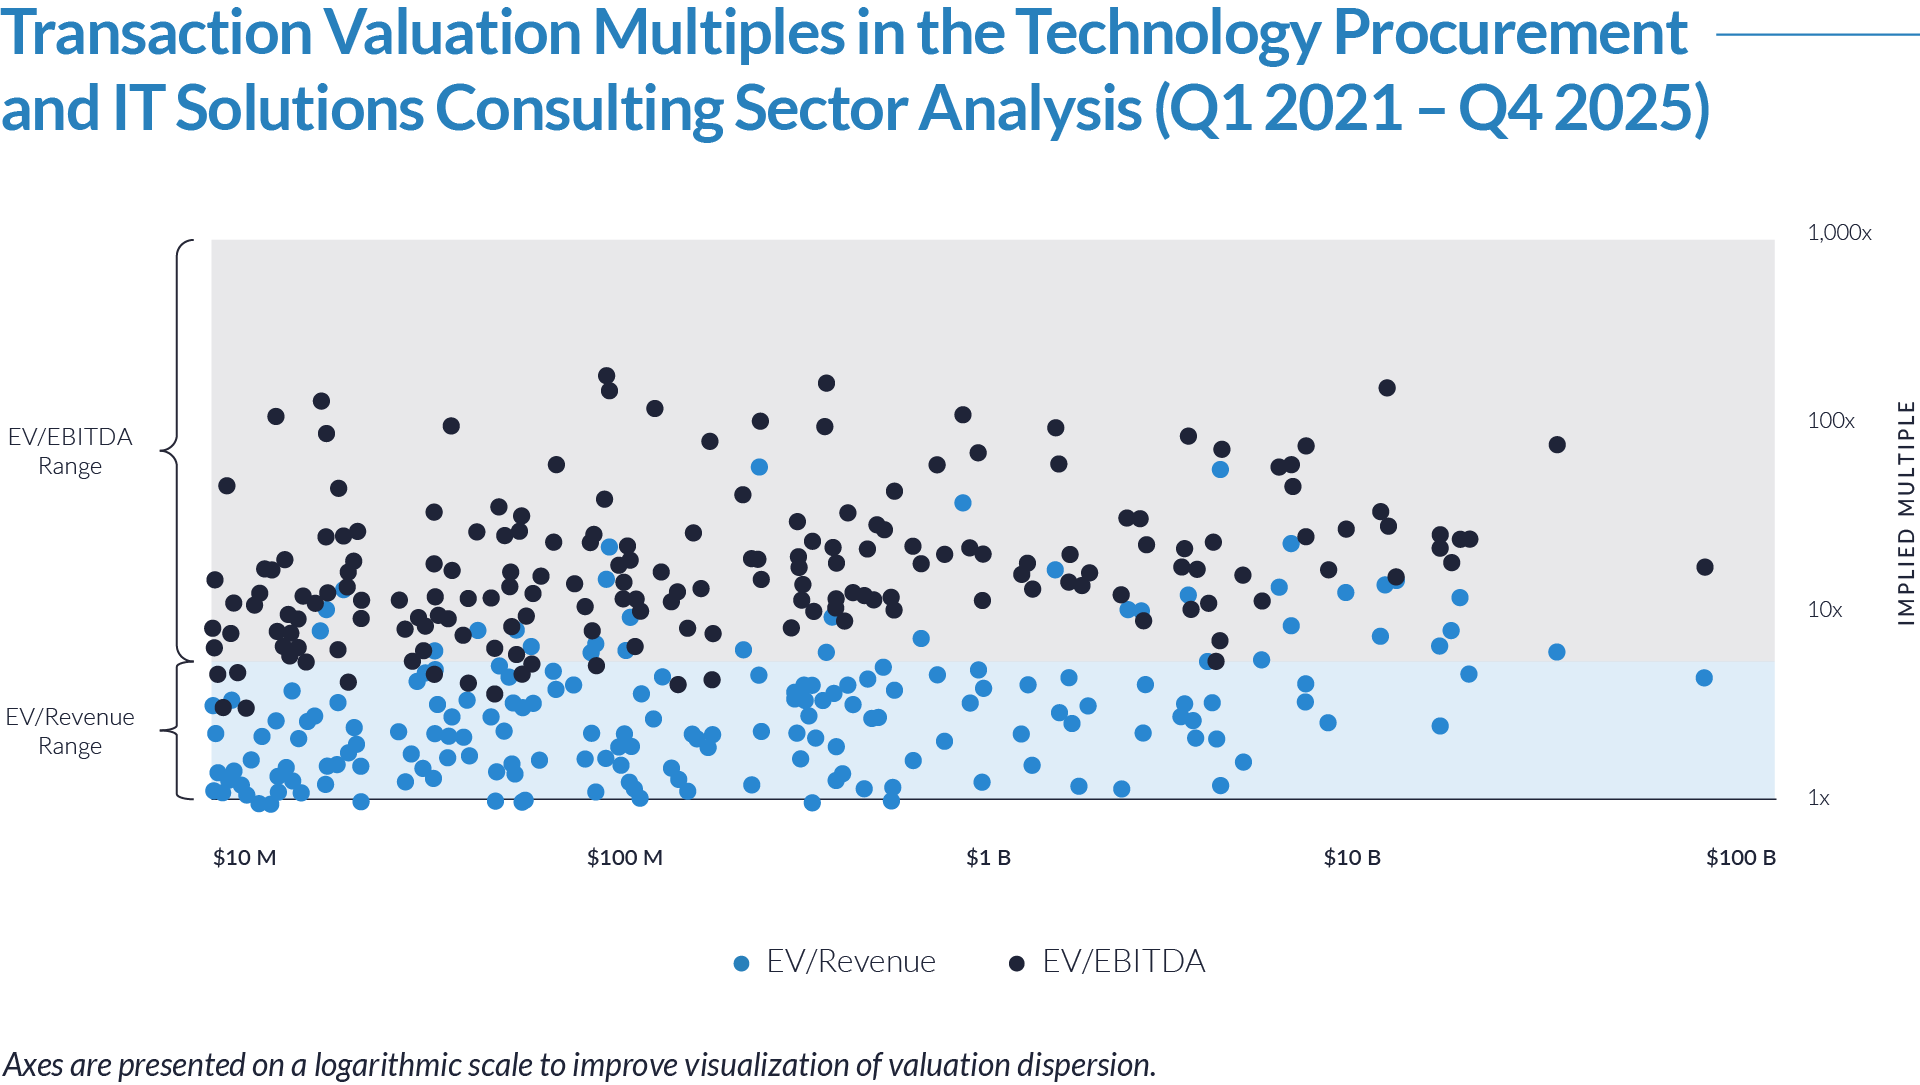
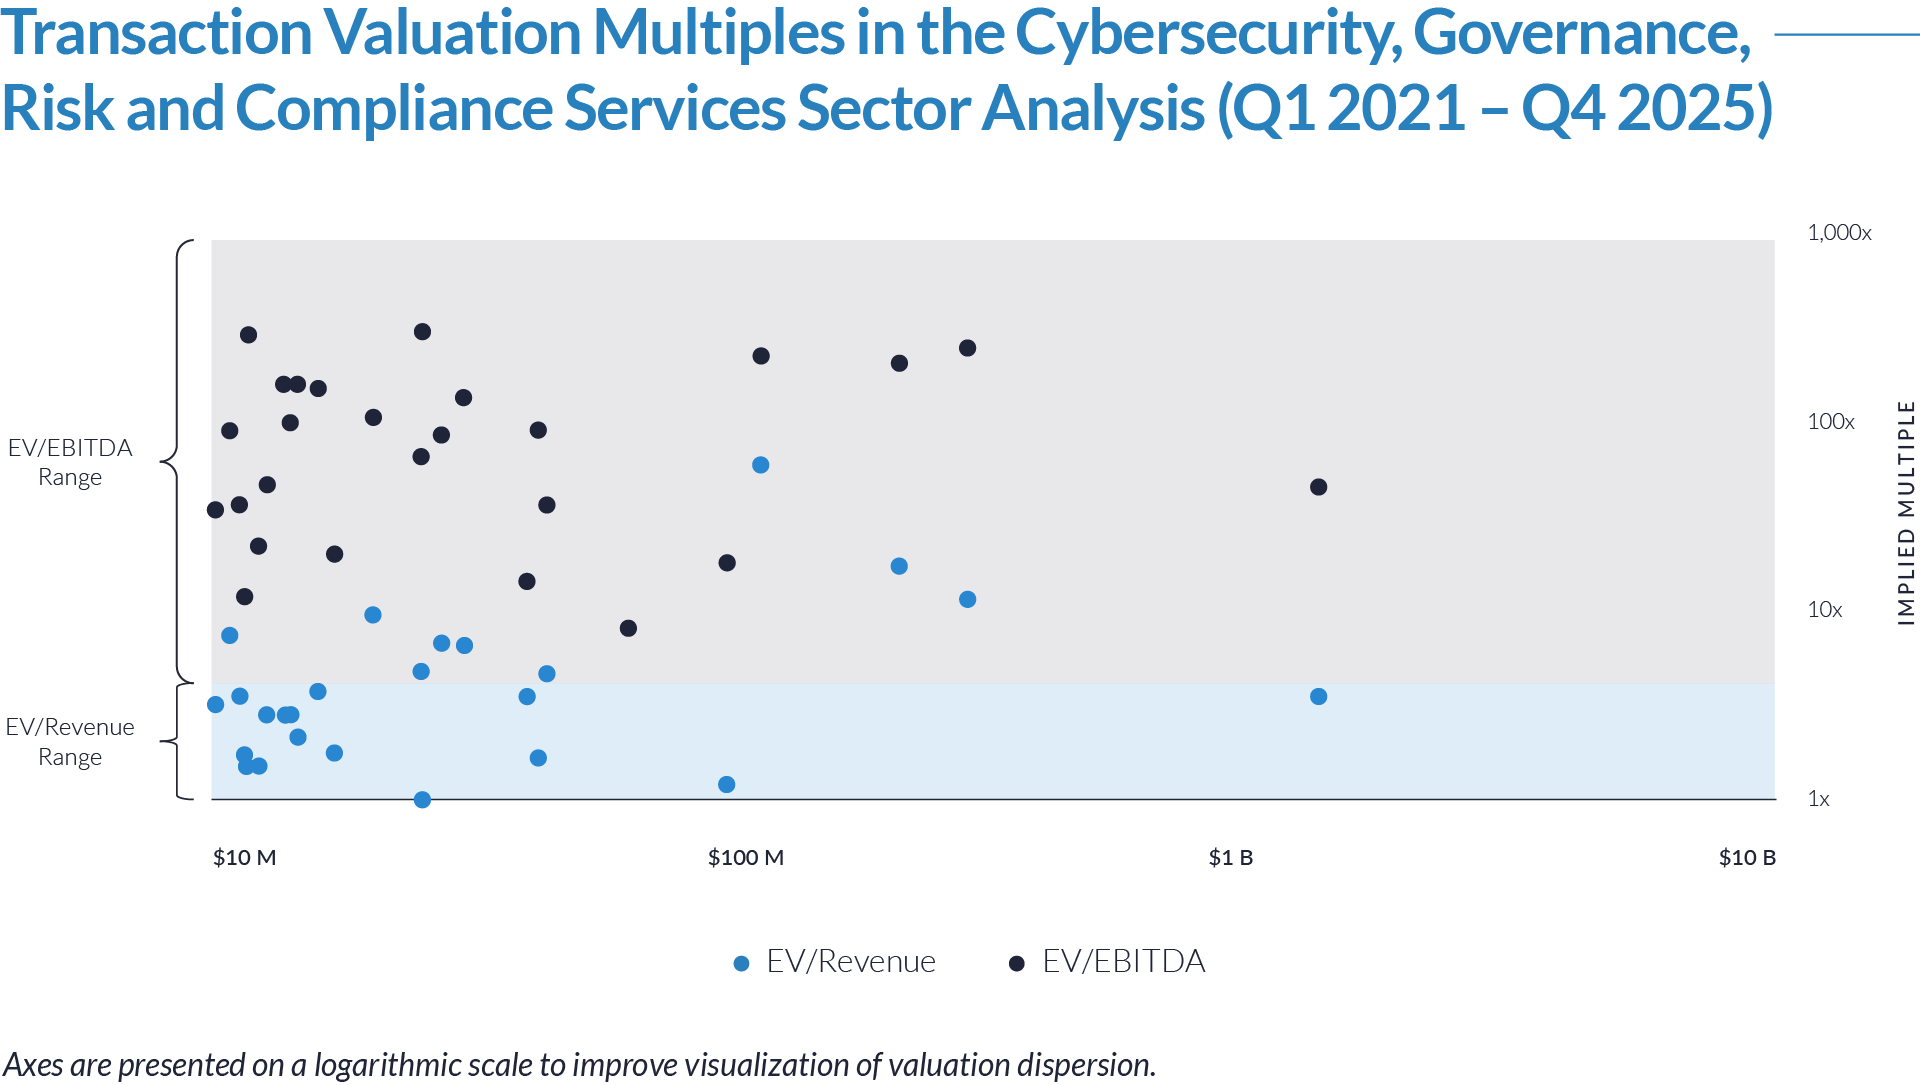
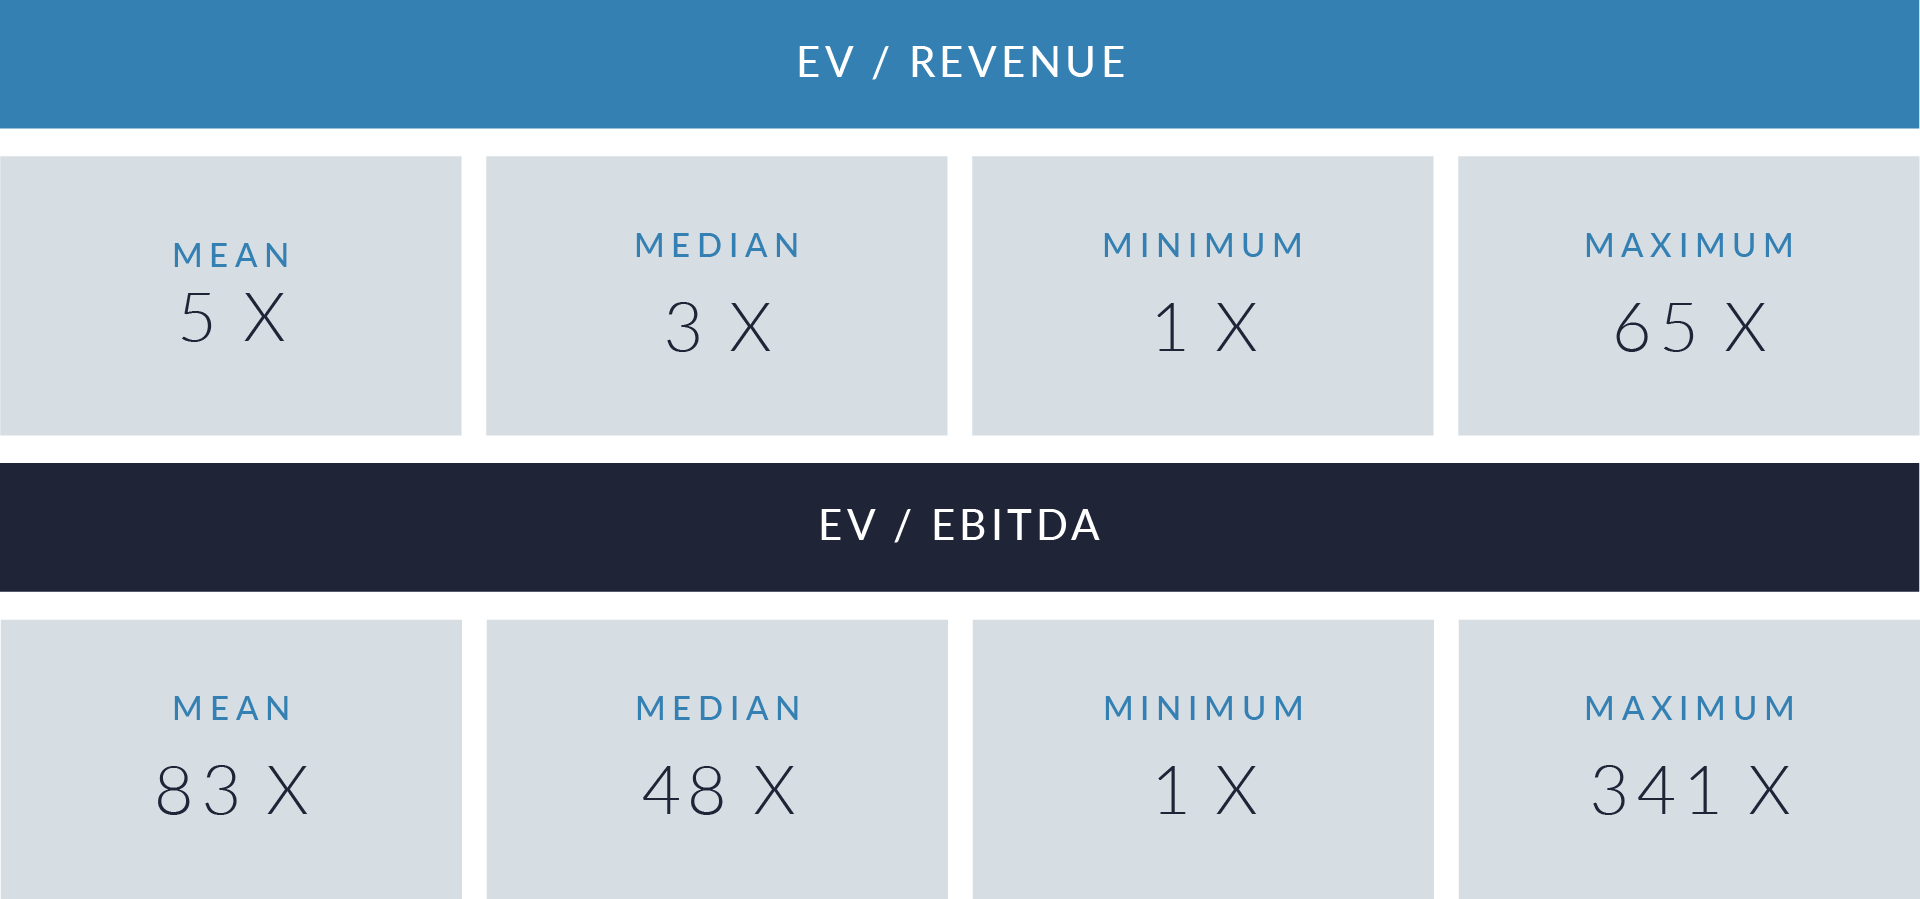
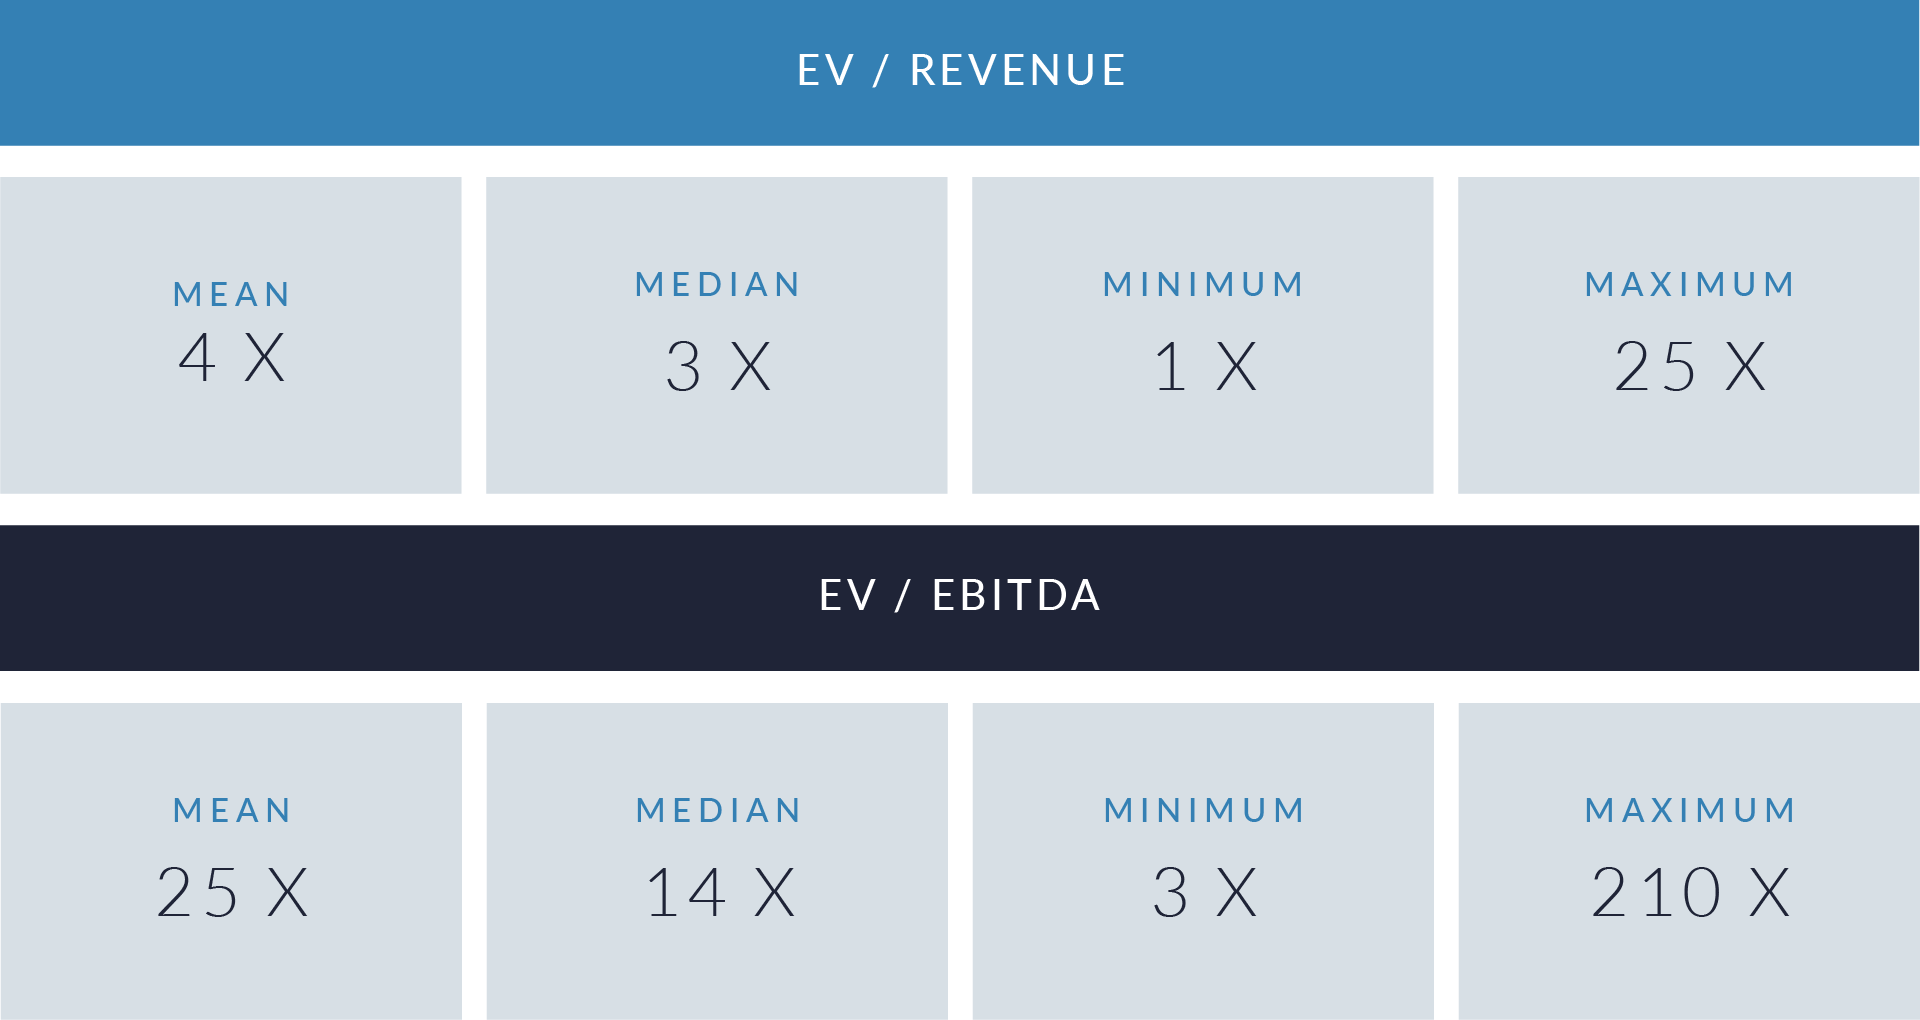
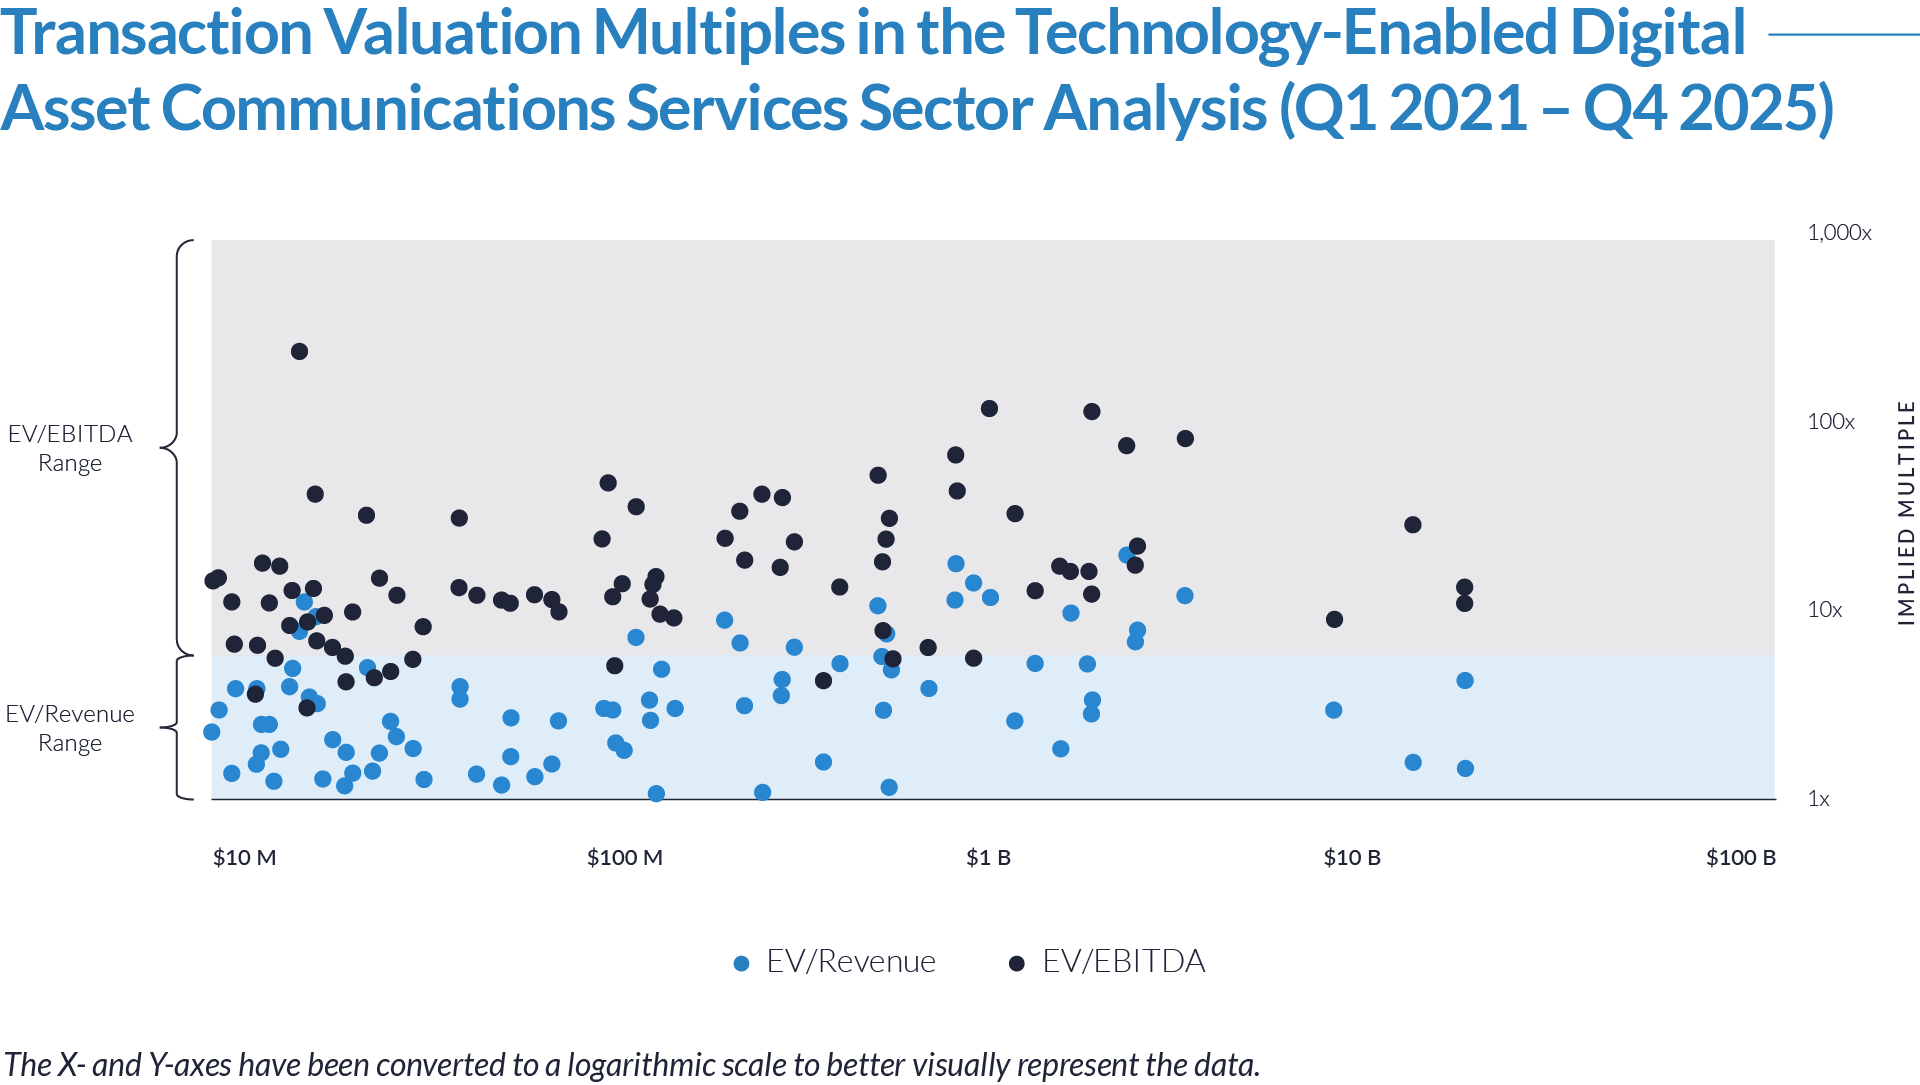
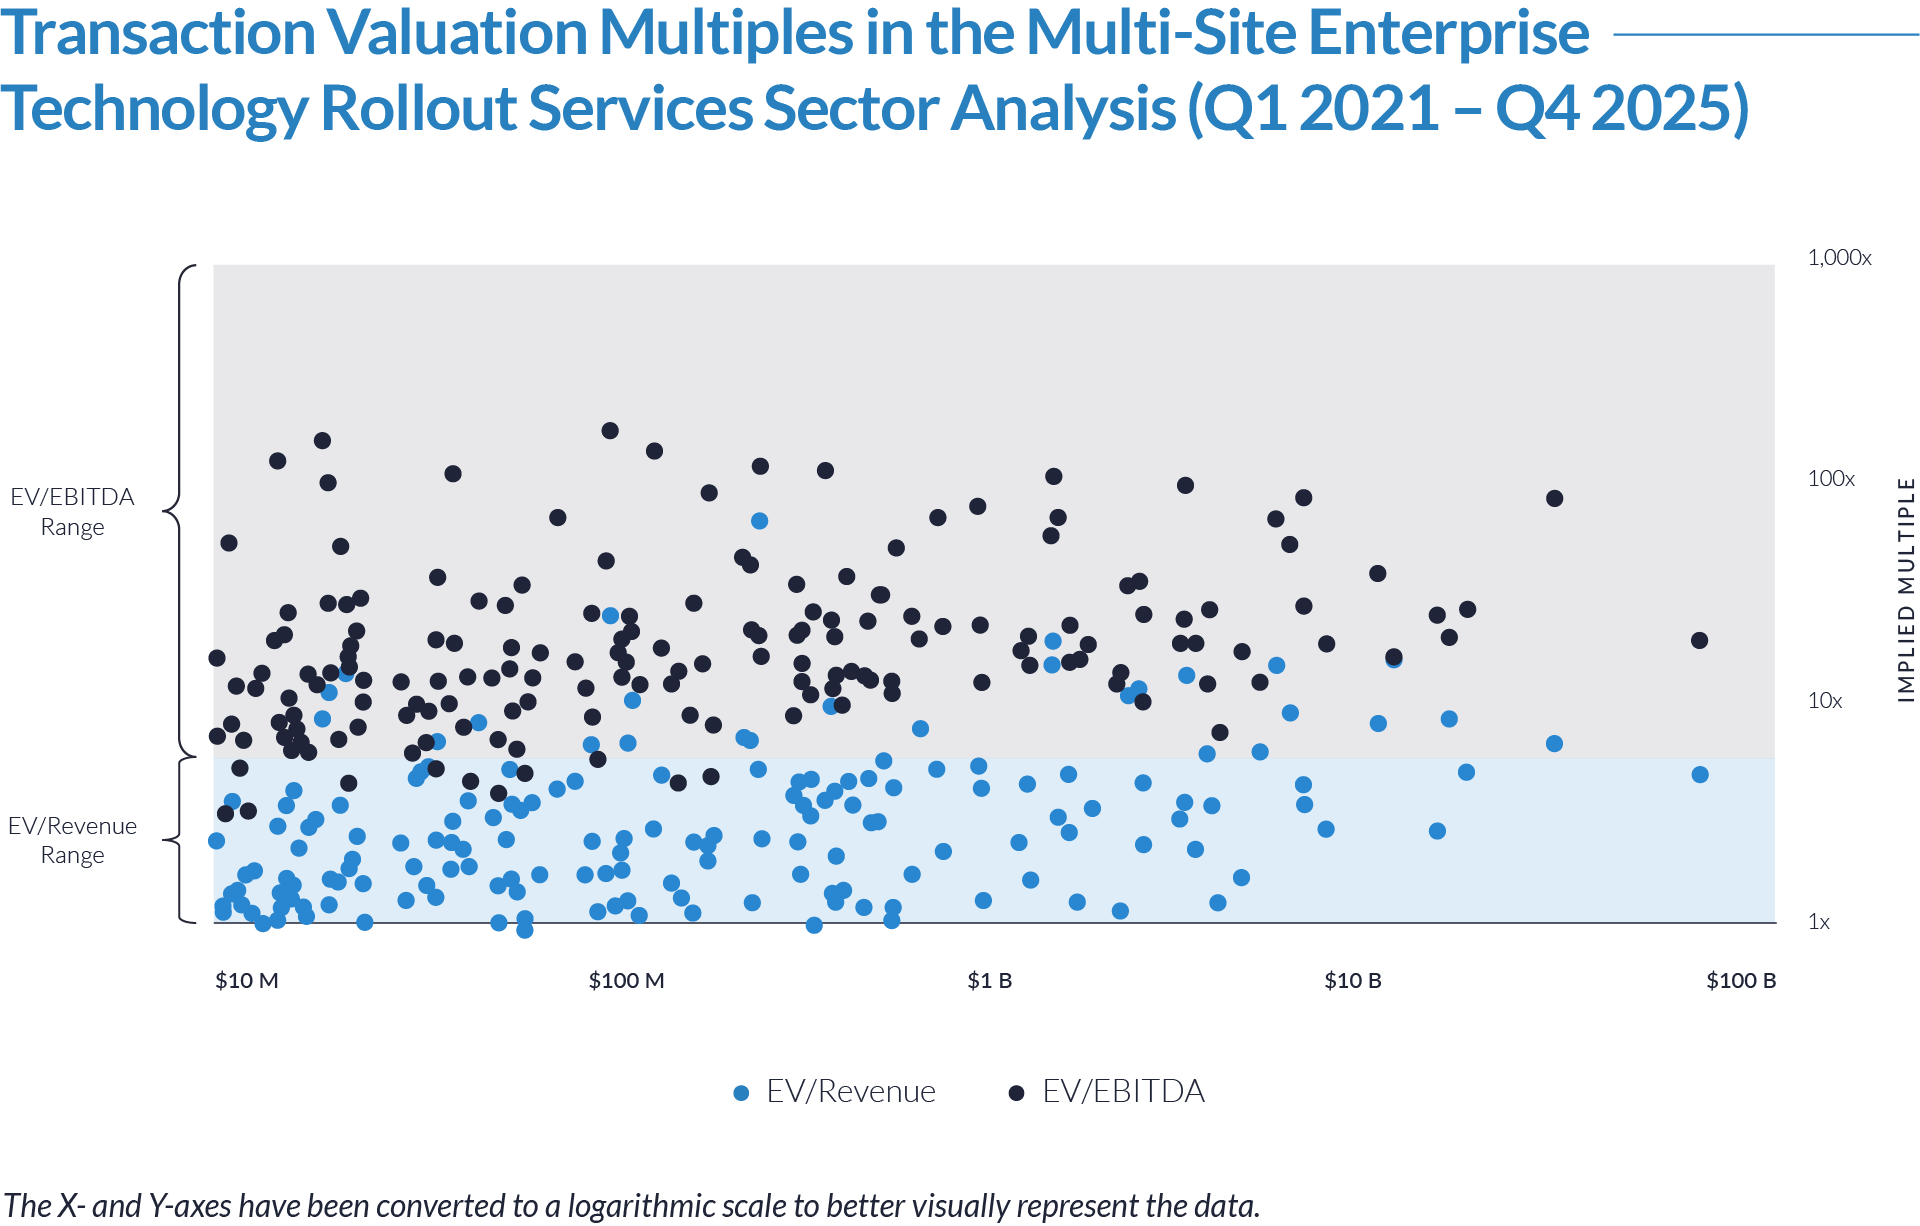
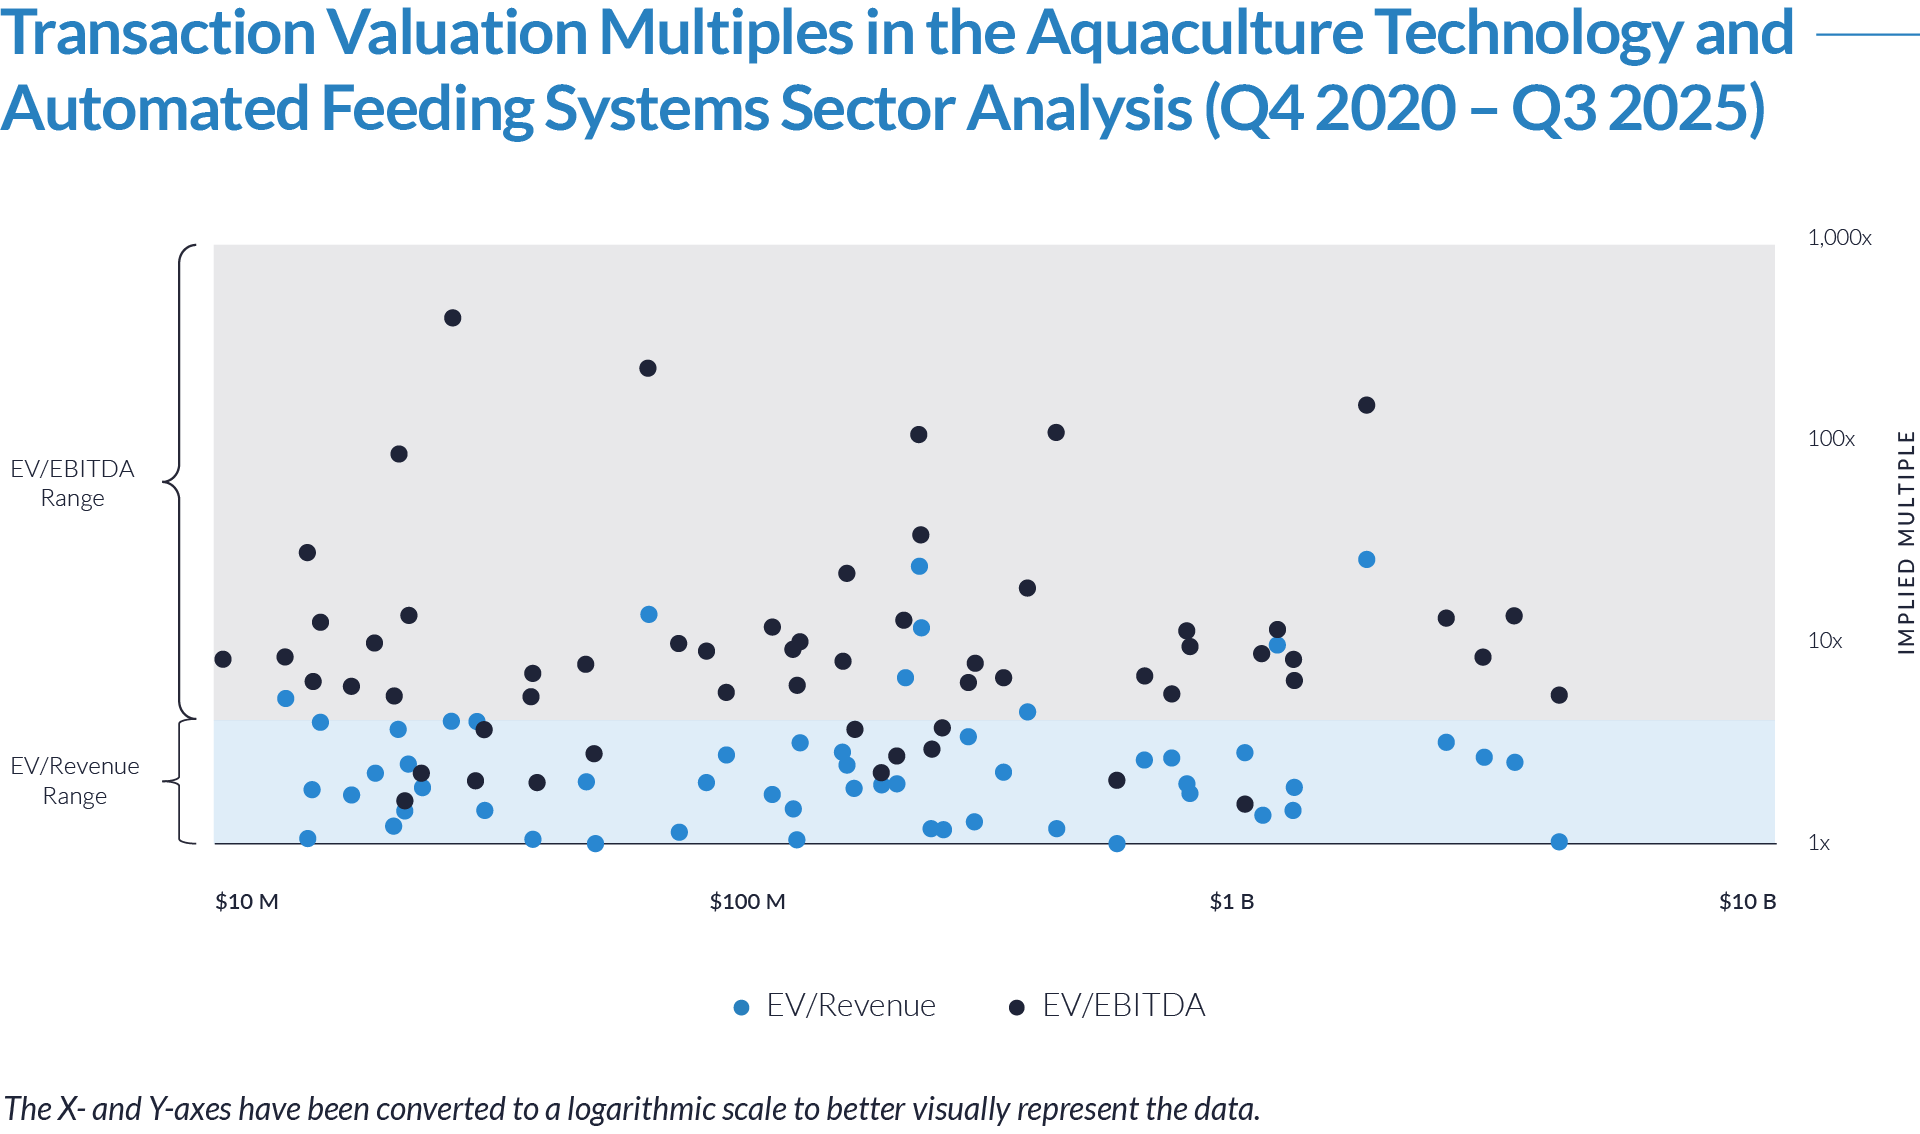
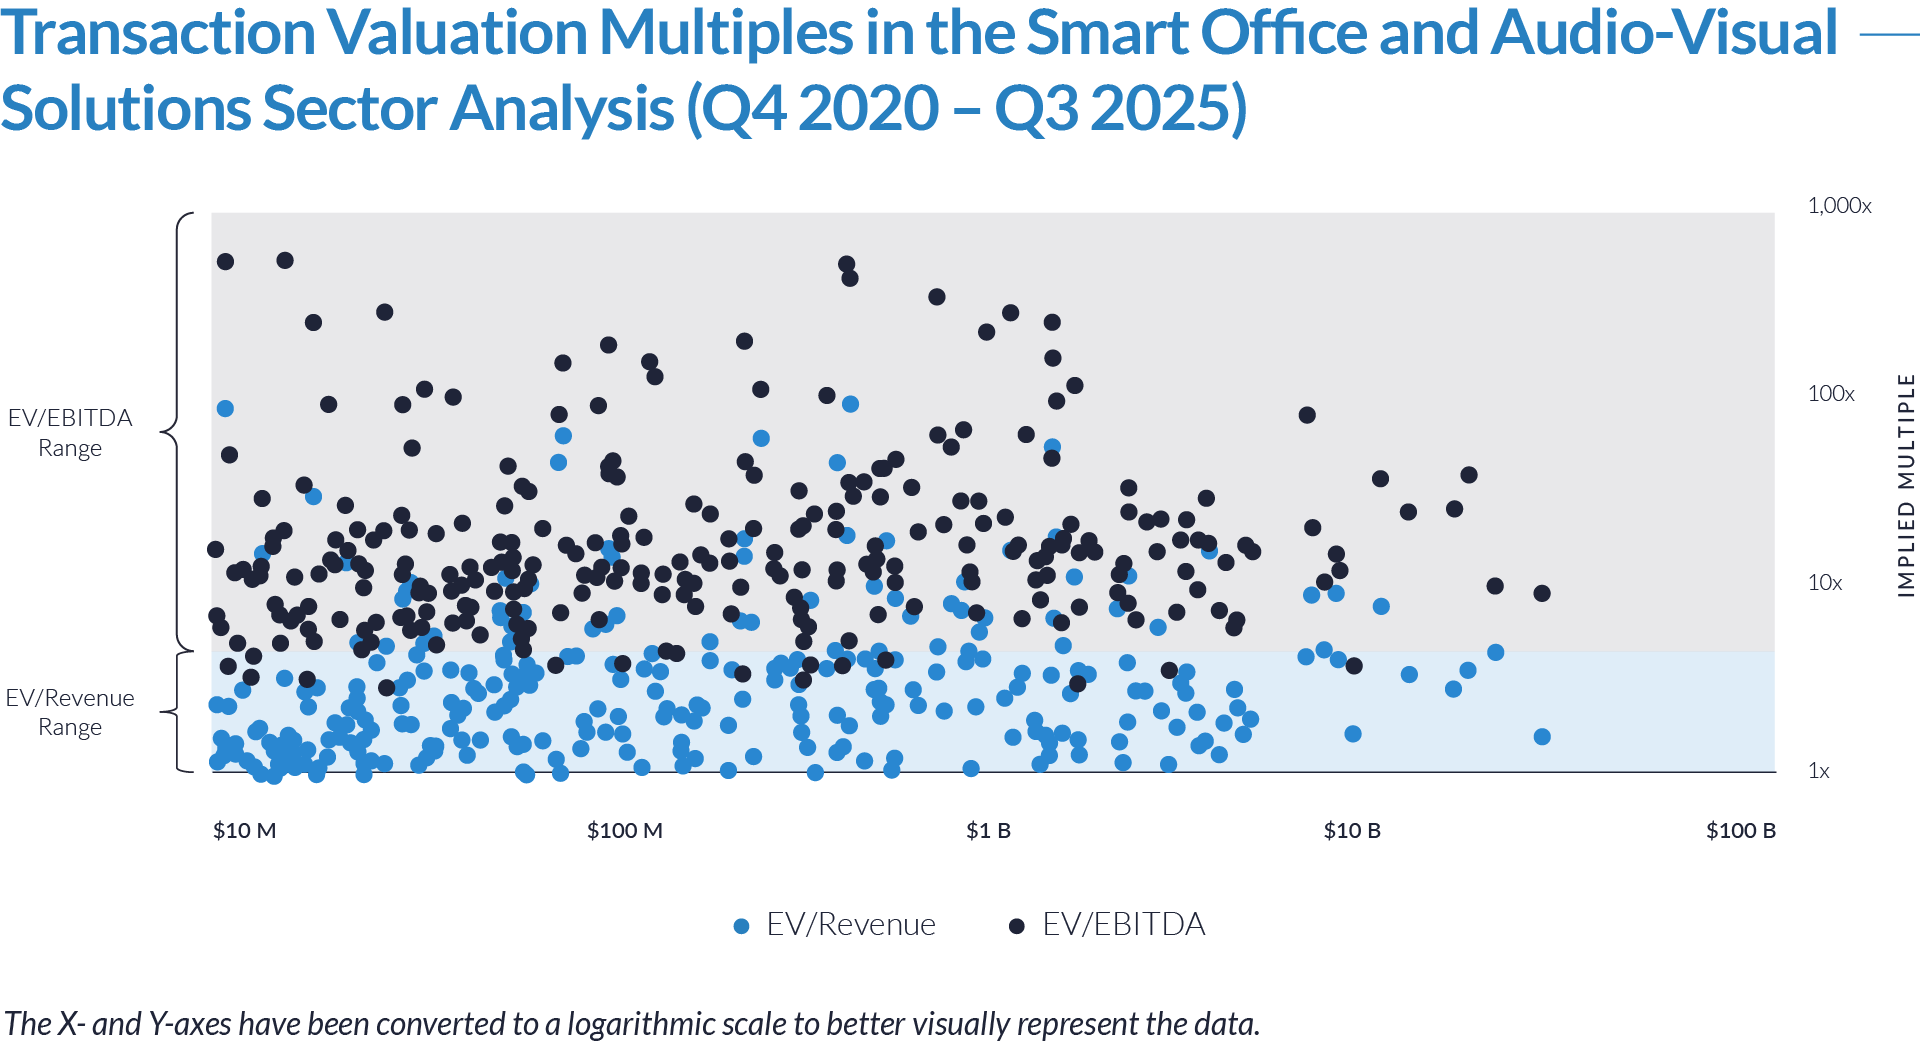
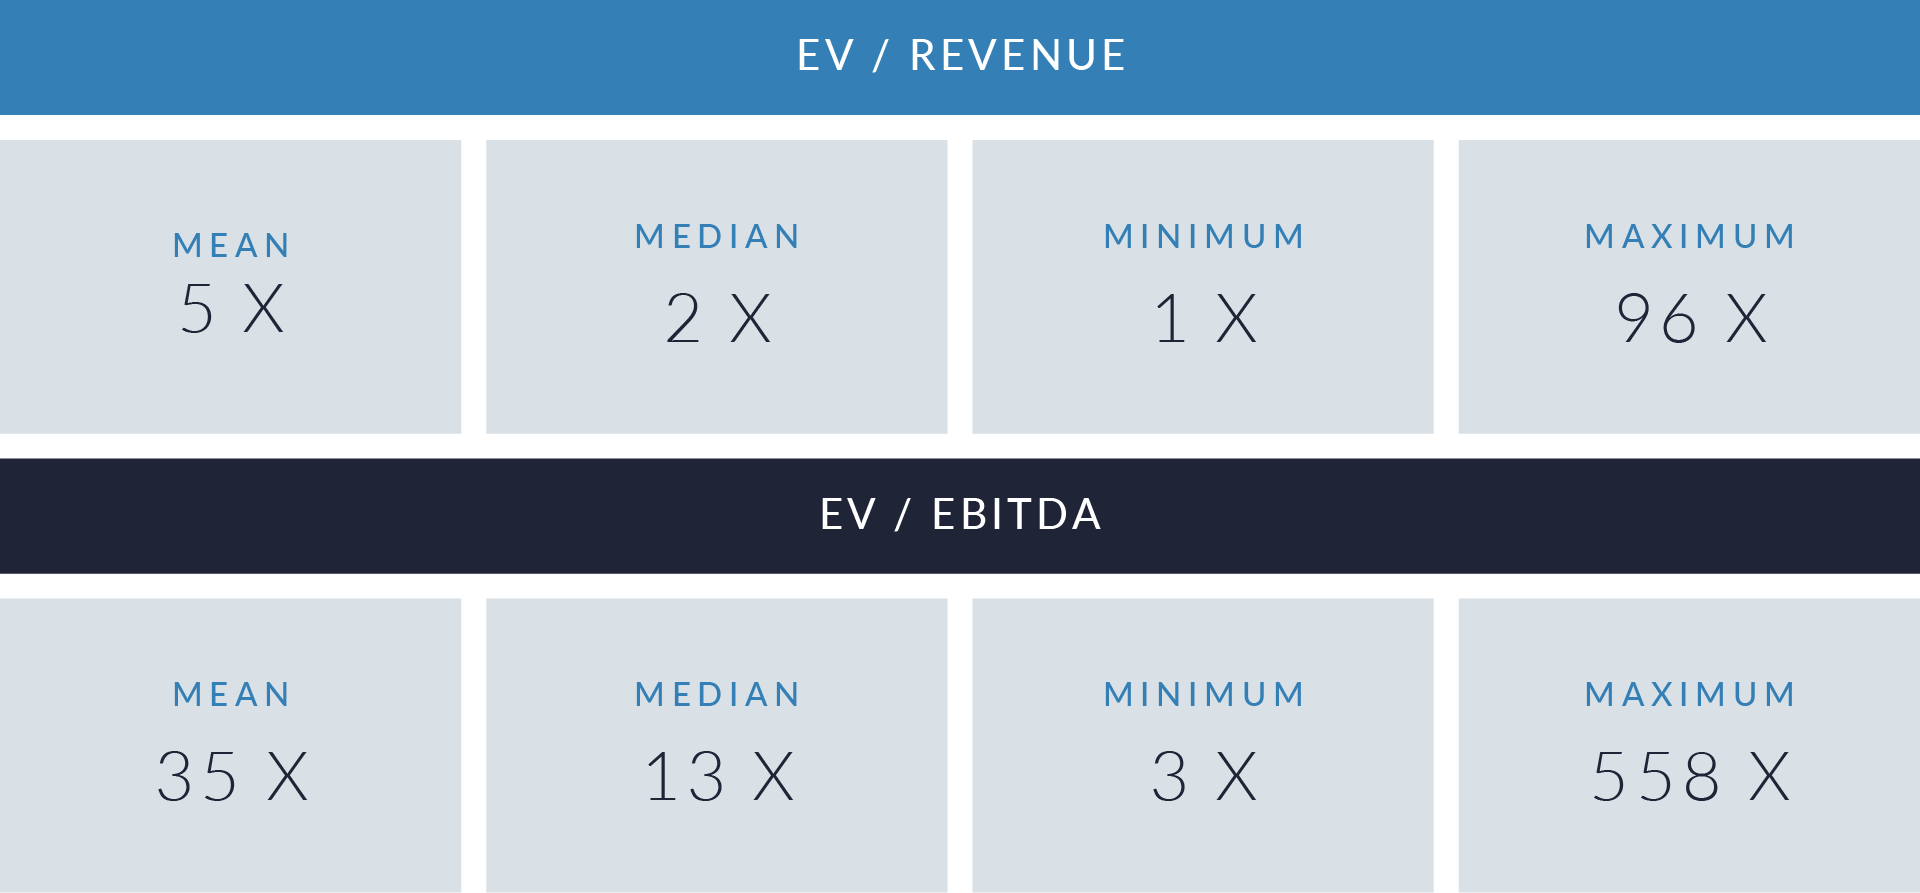
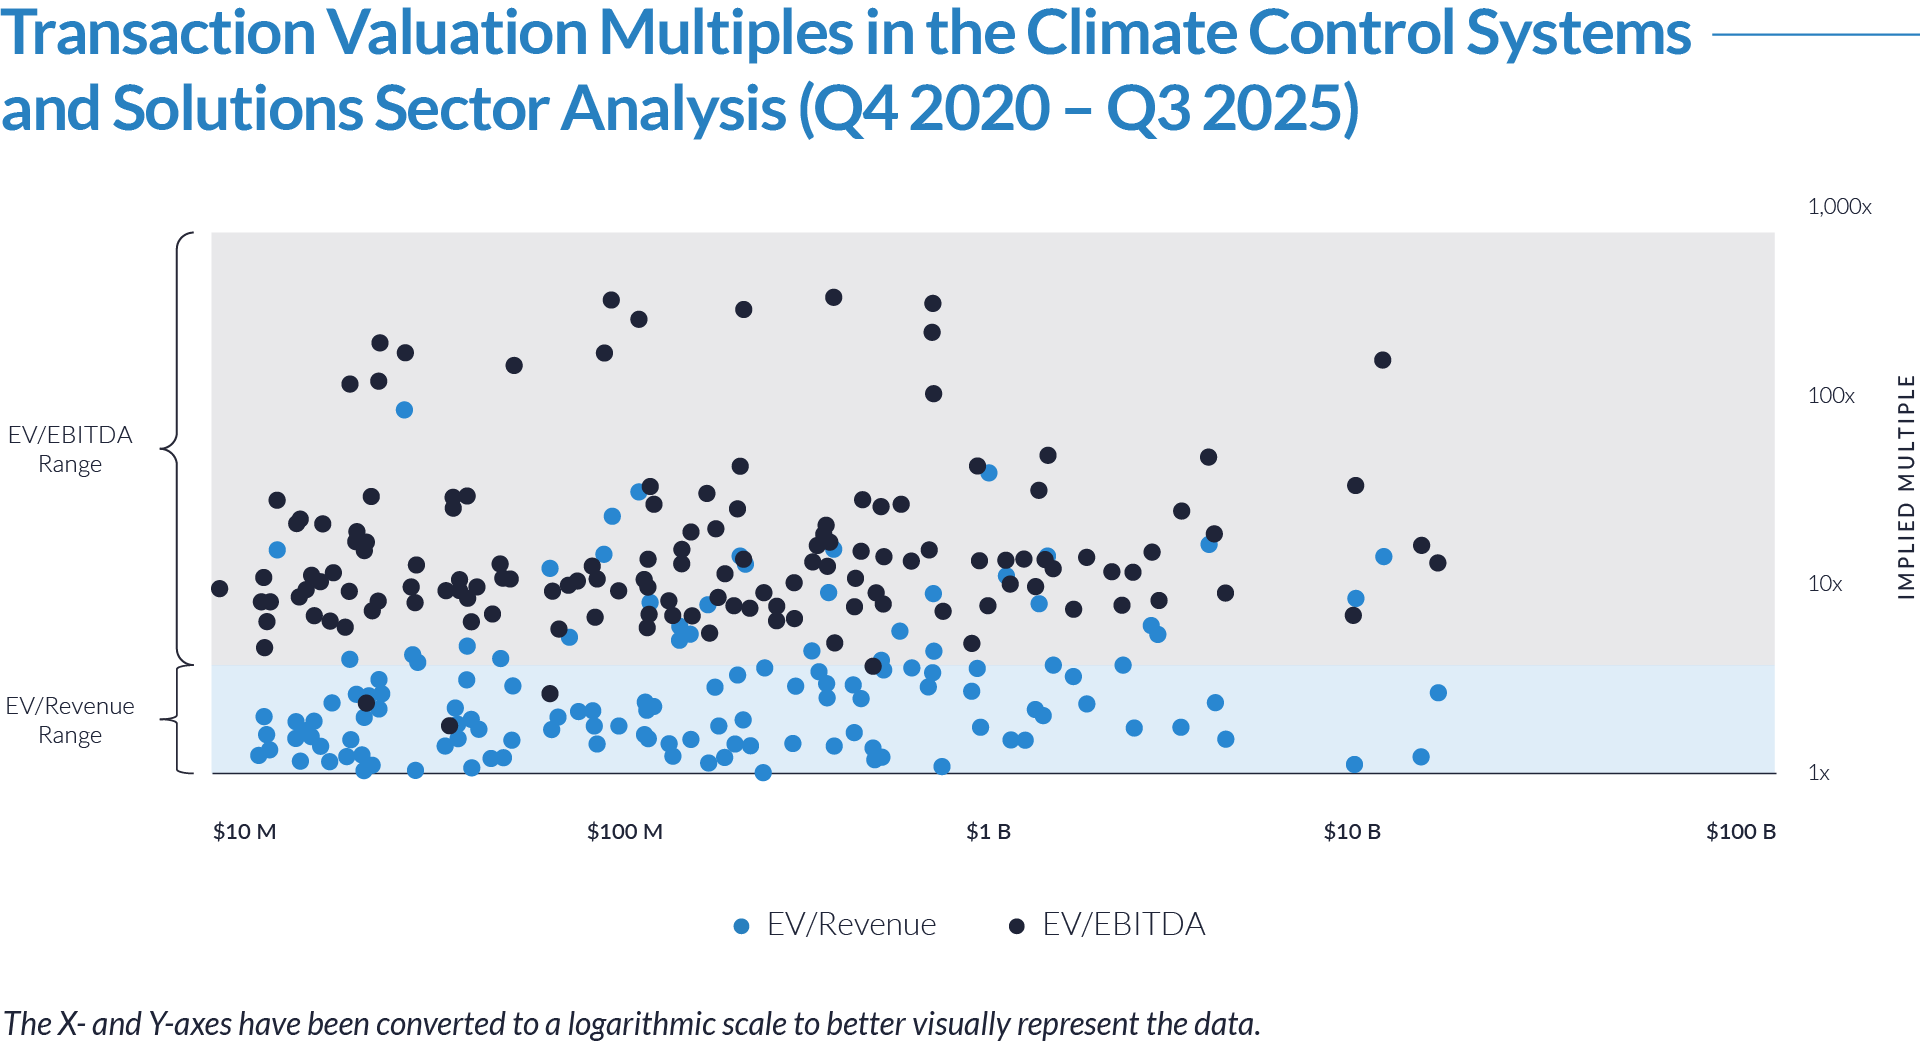
- Valuation multiples are based on a sample set of M&A transactions in the sector using data collected as of March 25, 2026.
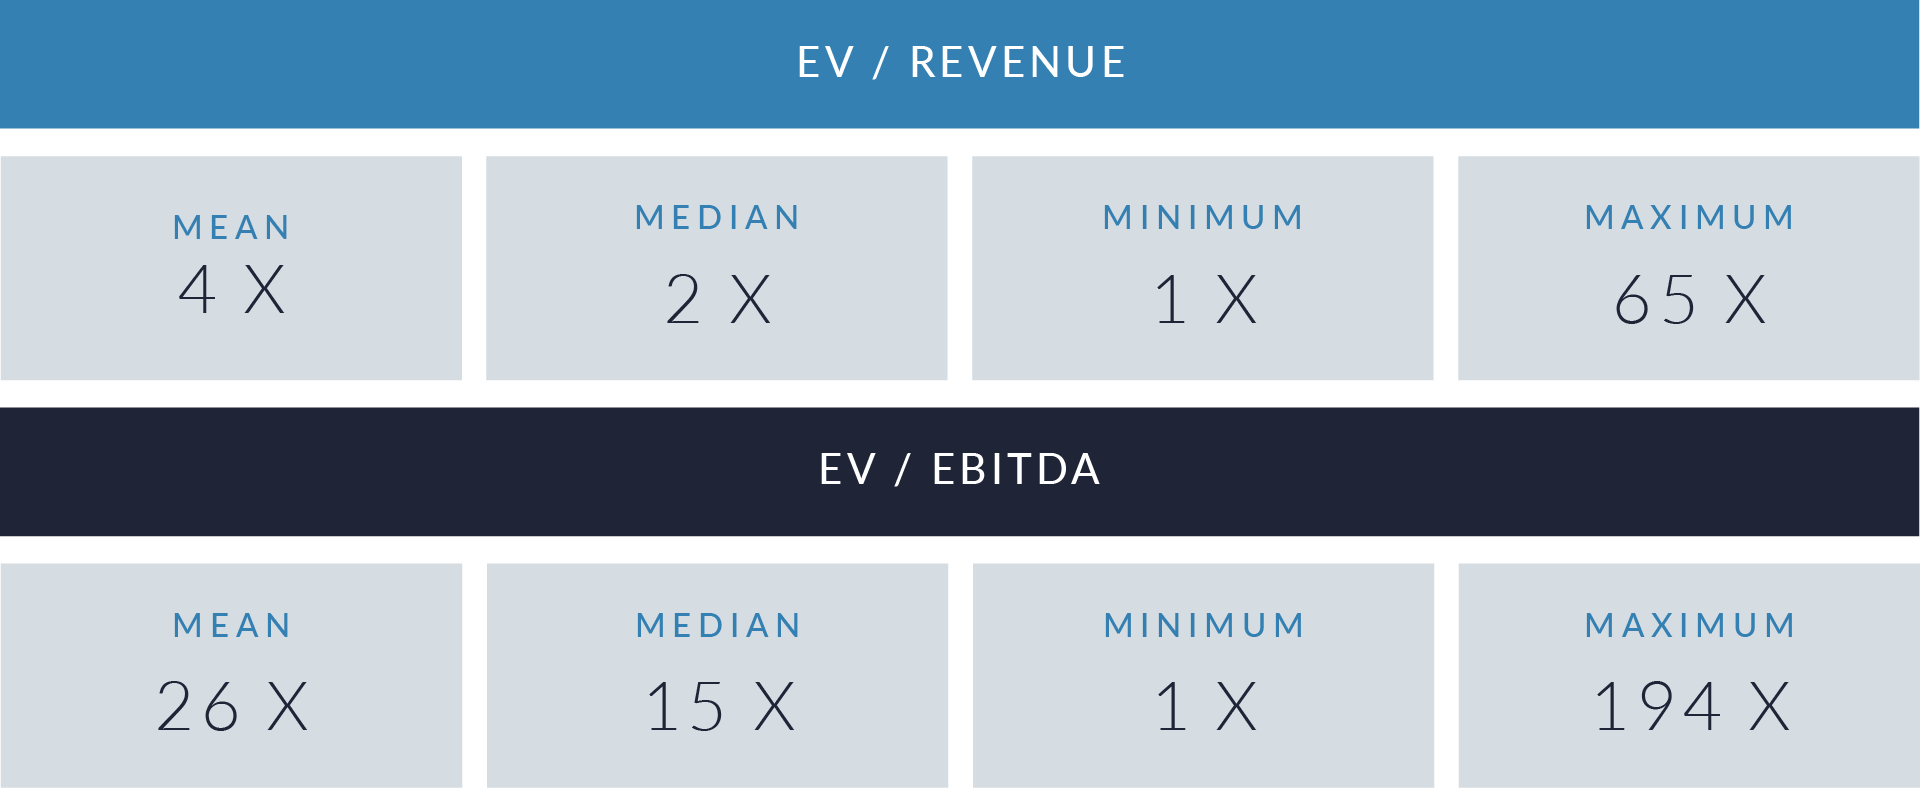
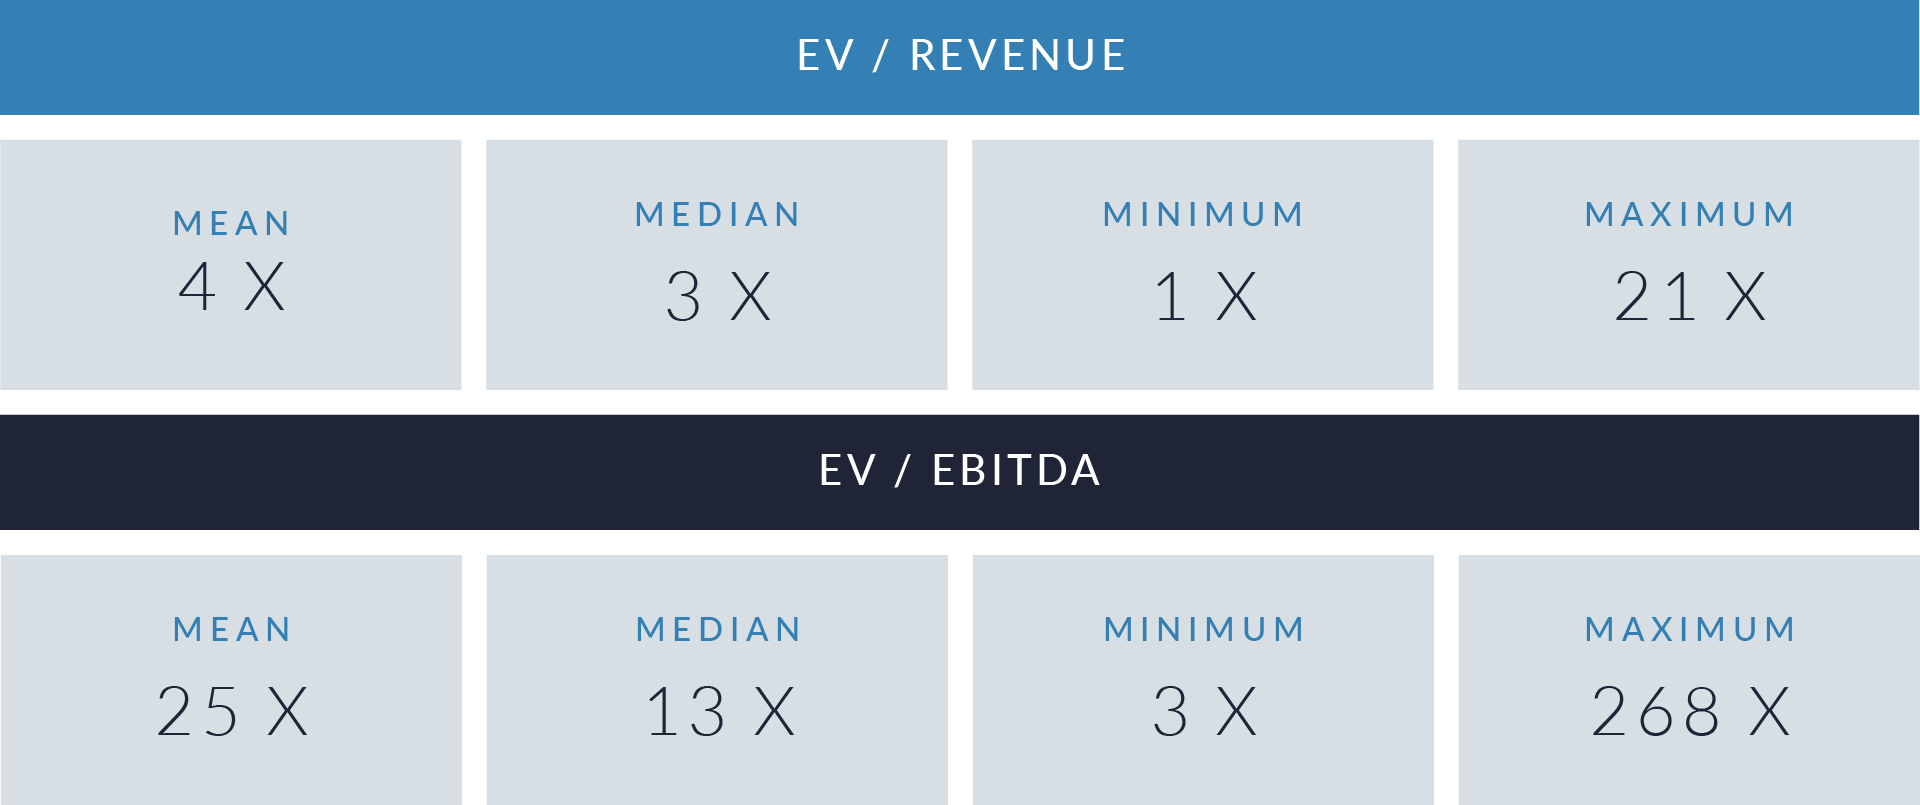
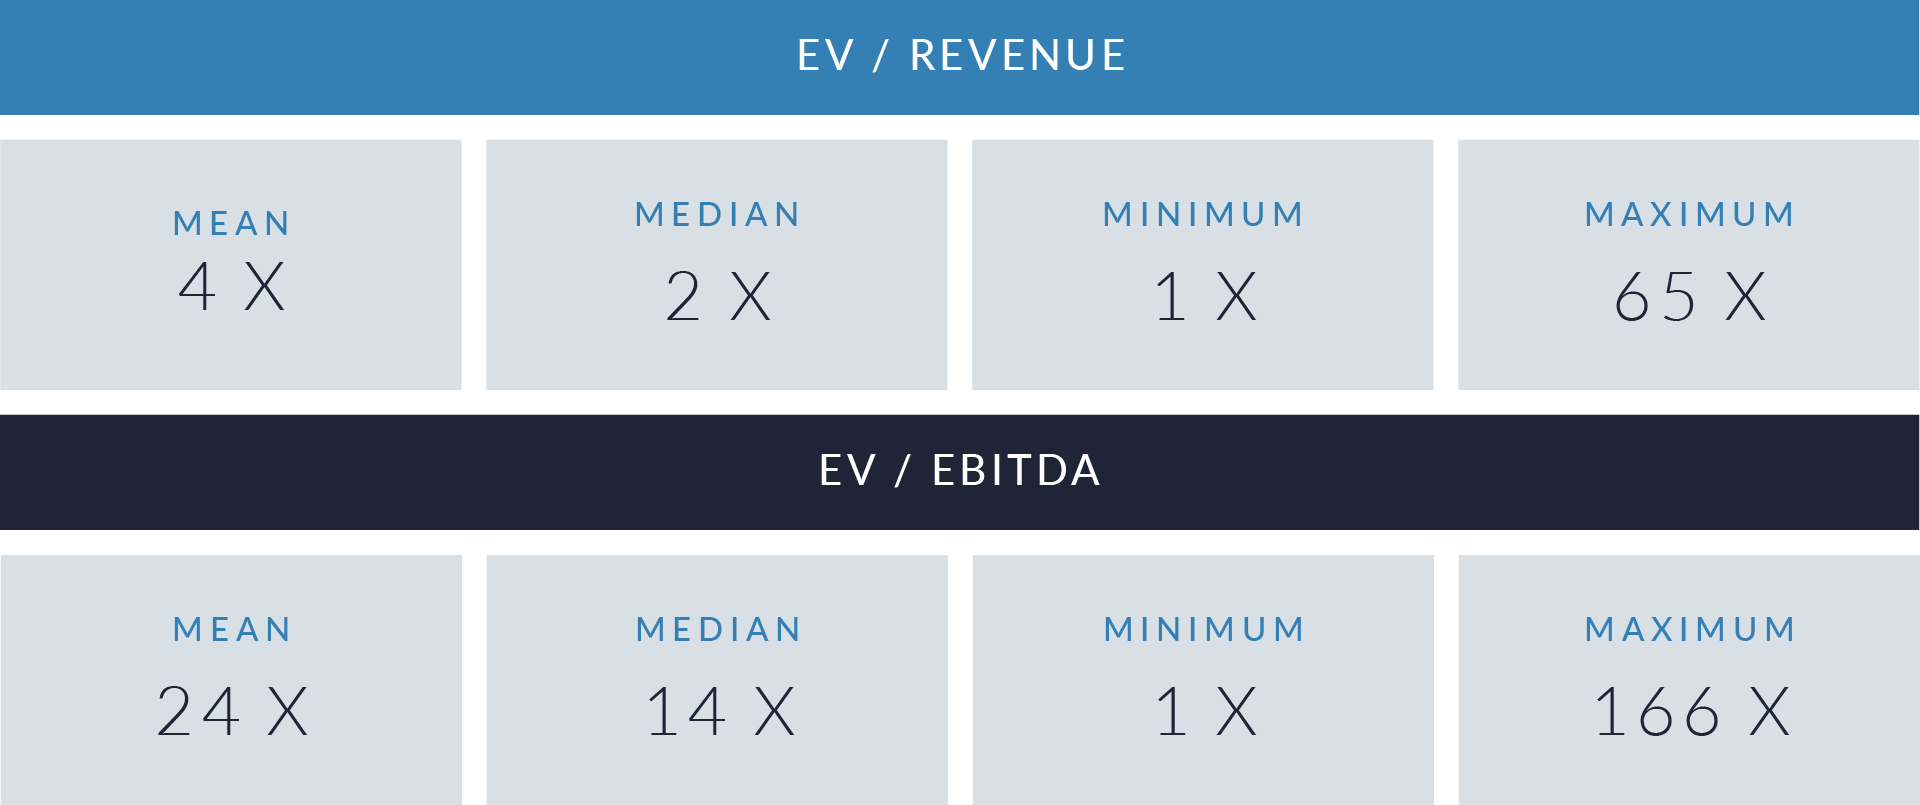
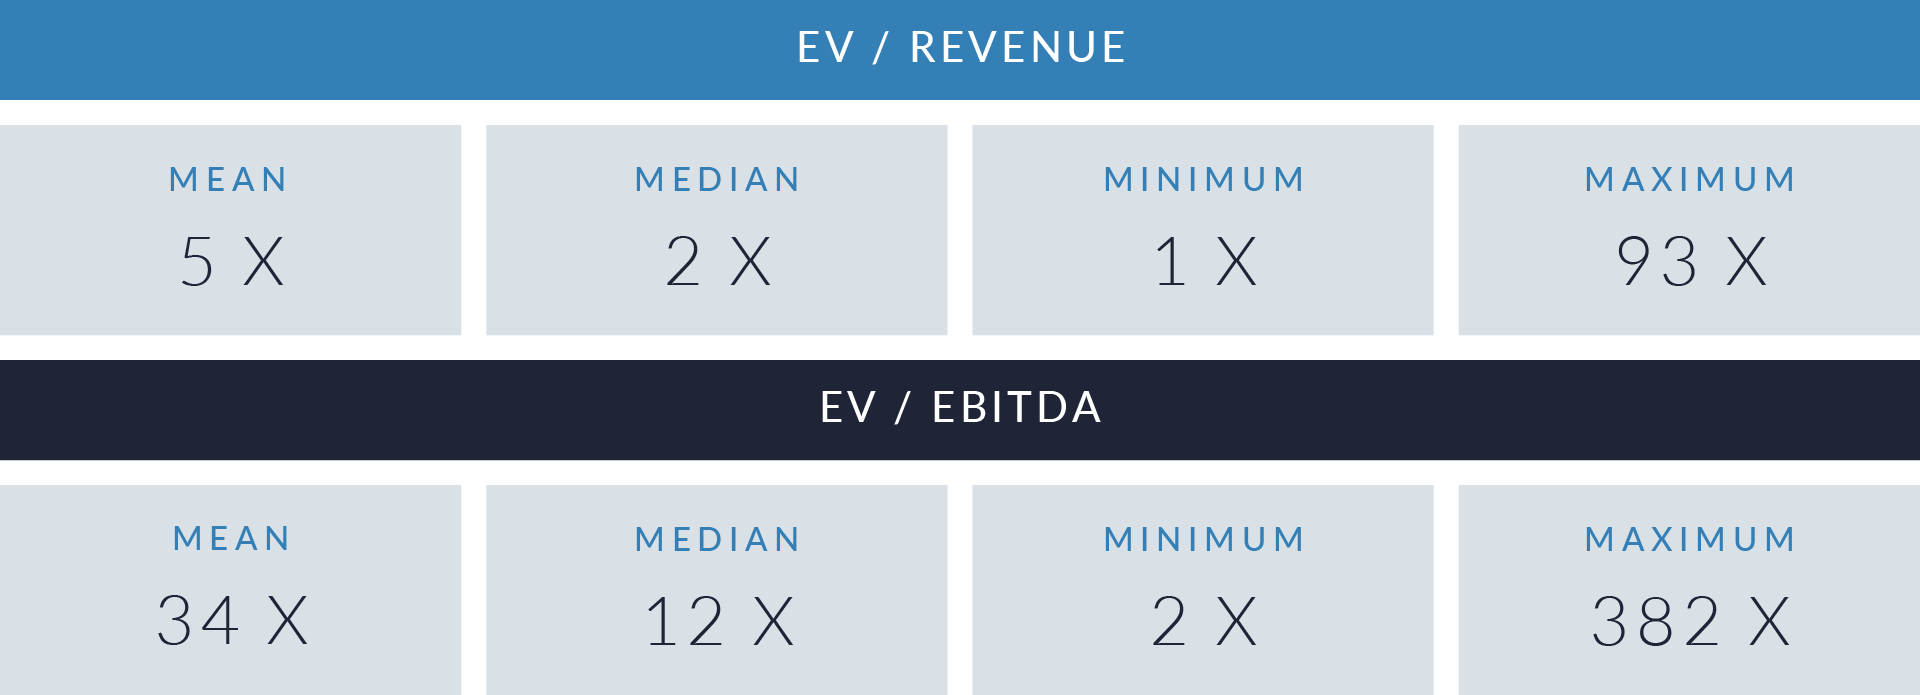
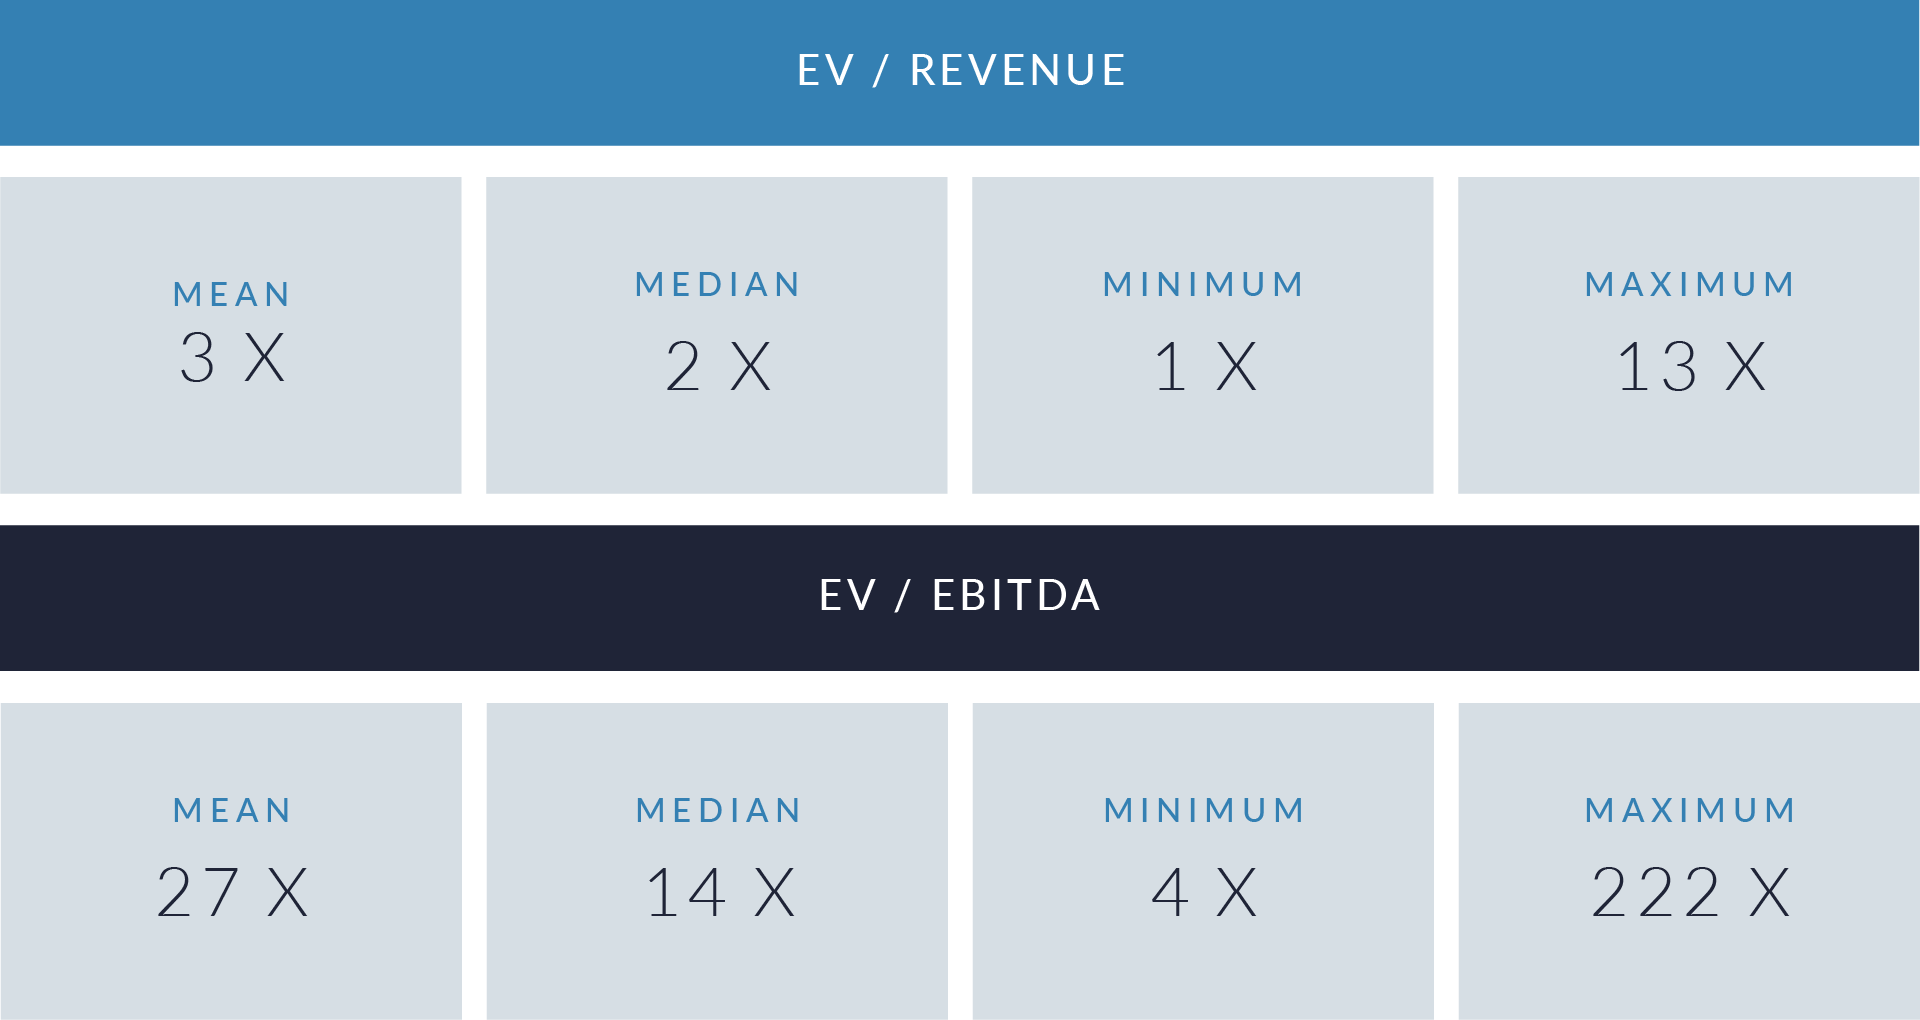
- EV/revenue multiples cluster in the low- to mid-single-digit range, with a median of 2x and a mean of 3x, reflecting the labor-intensive and relatively commoditized nature of staffing and workforce solutions models. While a limited number of scaled platforms command premium valuations (up to 13x), the broader market clears at more conservative levels, driven by constrained pricing power, project-based revenue exposure, and dependence on energy and infrastructure end-market cycles.
- EV/EBITDA multiples exhibit significant dispersion, ranging from 4x to 222x, with a median of 14x and a mean of 27x. The core concentration in the 10x–20x range indicates that most transactions are priced on steady-state cash flow generation, while outliers reflect temporarily depressed earnings, reinvestment-heavy growth models, or strategic platform acquisitions. Elevated multiples in select cases suggest that acquirers are underwriting forward margin expansion, operational scaling, and increased penetration of higher-value workforce solutions and managed services.
- Valuation outcomes are strongly influenced by scale, sector specialization, and revenue visibility. Larger, diversified workforce platforms serving energy and infrastructure clients tend to command more defensible multiples, supported by recurring contractor demand, long-term project pipelines, and embedded client relationships. In contrast, smaller or regionally focused staffing firms exhibit greater multiple compression and volatility, reflecting higher exposure to project cyclicality, contract concentration, and variability in utilization rates.

Capital Markets Activities
The data highlights transaction volume, capital deployment, deal structure, and geographic investment patterns across the energy and infrastructure staffing and workforce solutions sector. Over the past five years, M&A activity has been driven by consolidation across a highly fragmented provider landscape, with strategic acquirers and financial sponsors targeting scalable platforms capable of supporting multi-region, project-based workforce demand. Investors are increasingly focused on businesses with diversified end-market exposure, recurring contractor utilization, and the operational infrastructure required to deliver workforce solutions across complex, multi-site environments. Capital deployment trends indicate a shift toward larger platform transactions, reflecting continued sponsor interest in building scaled, globally integrated workforce solutions providers.
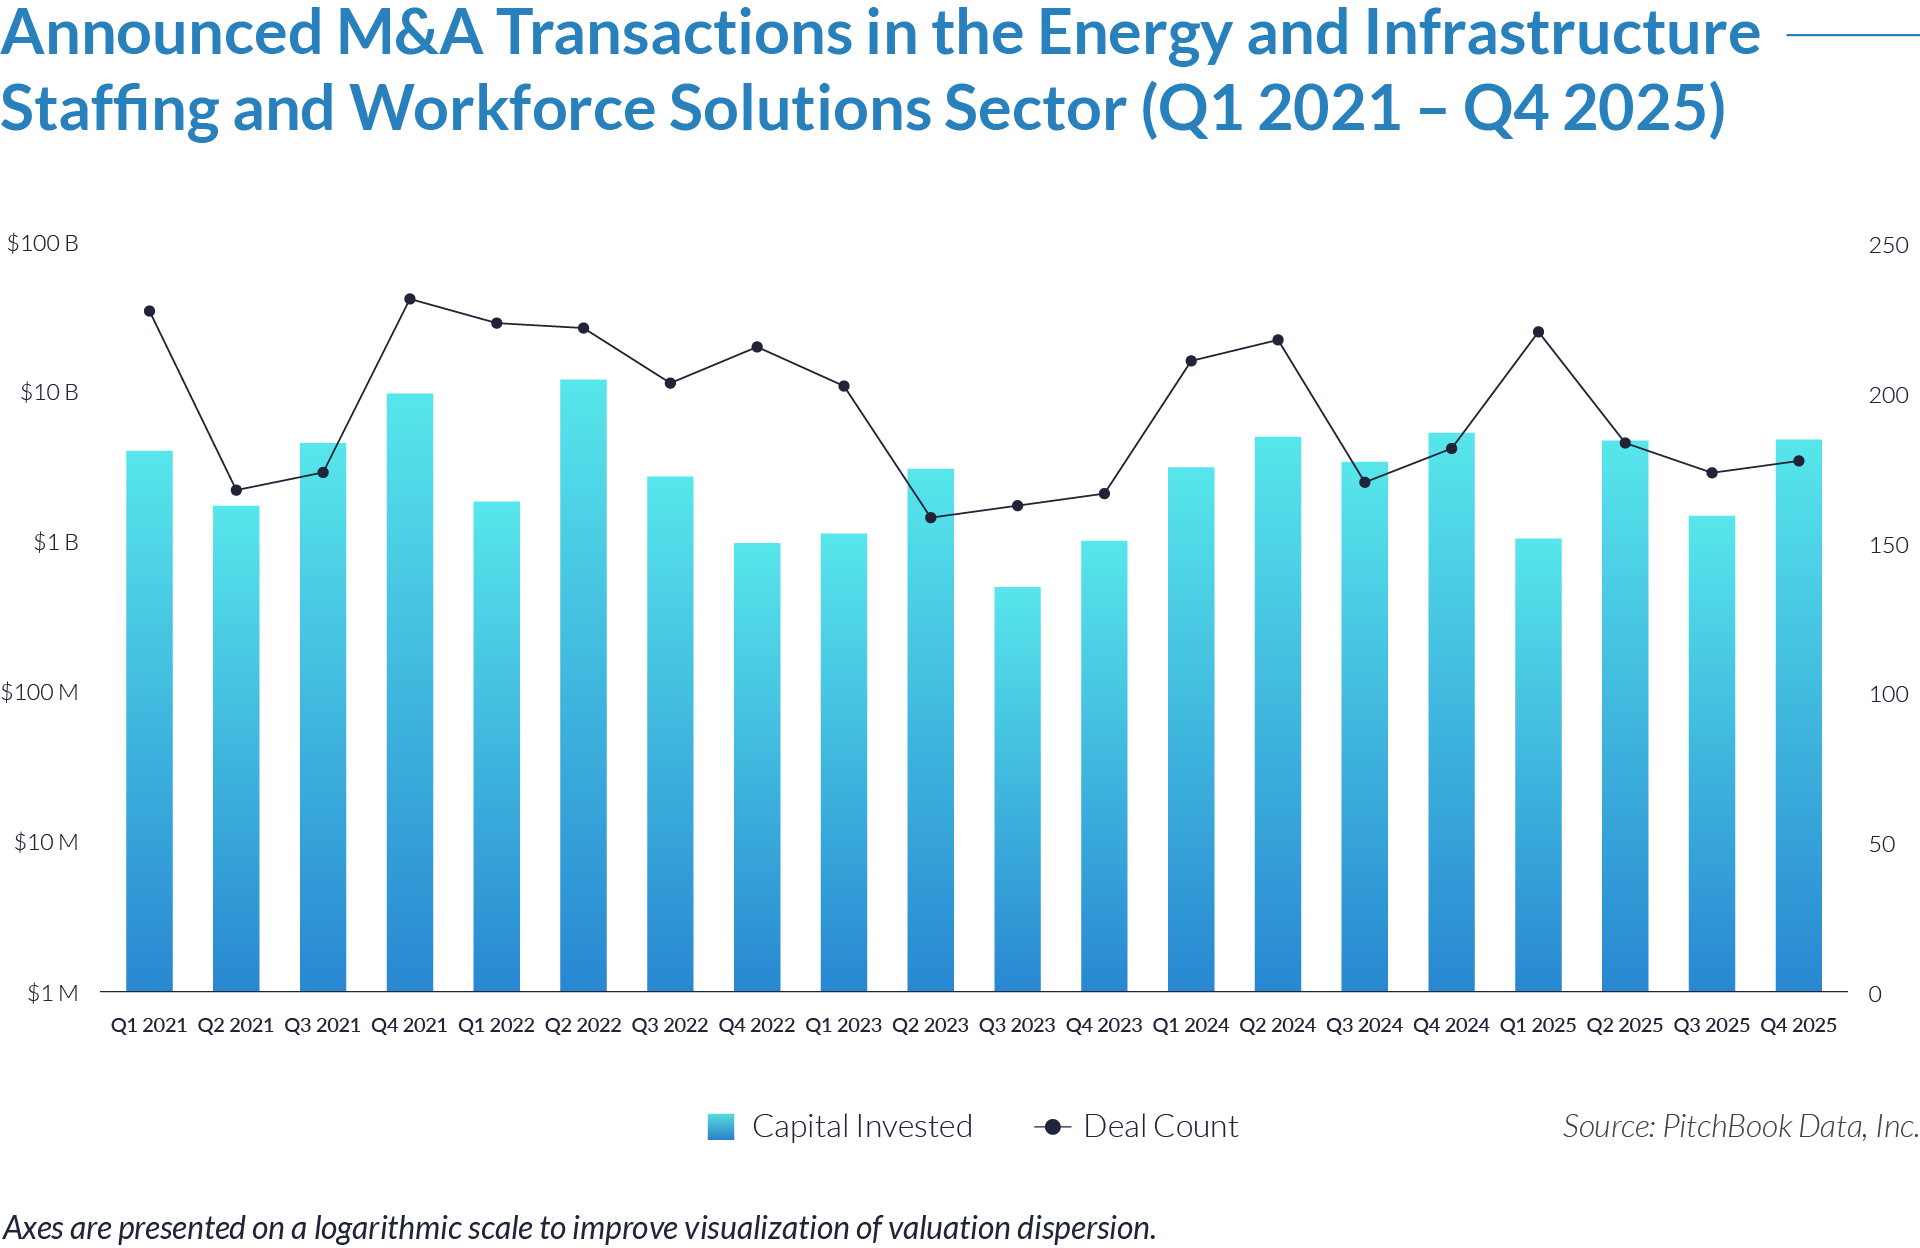
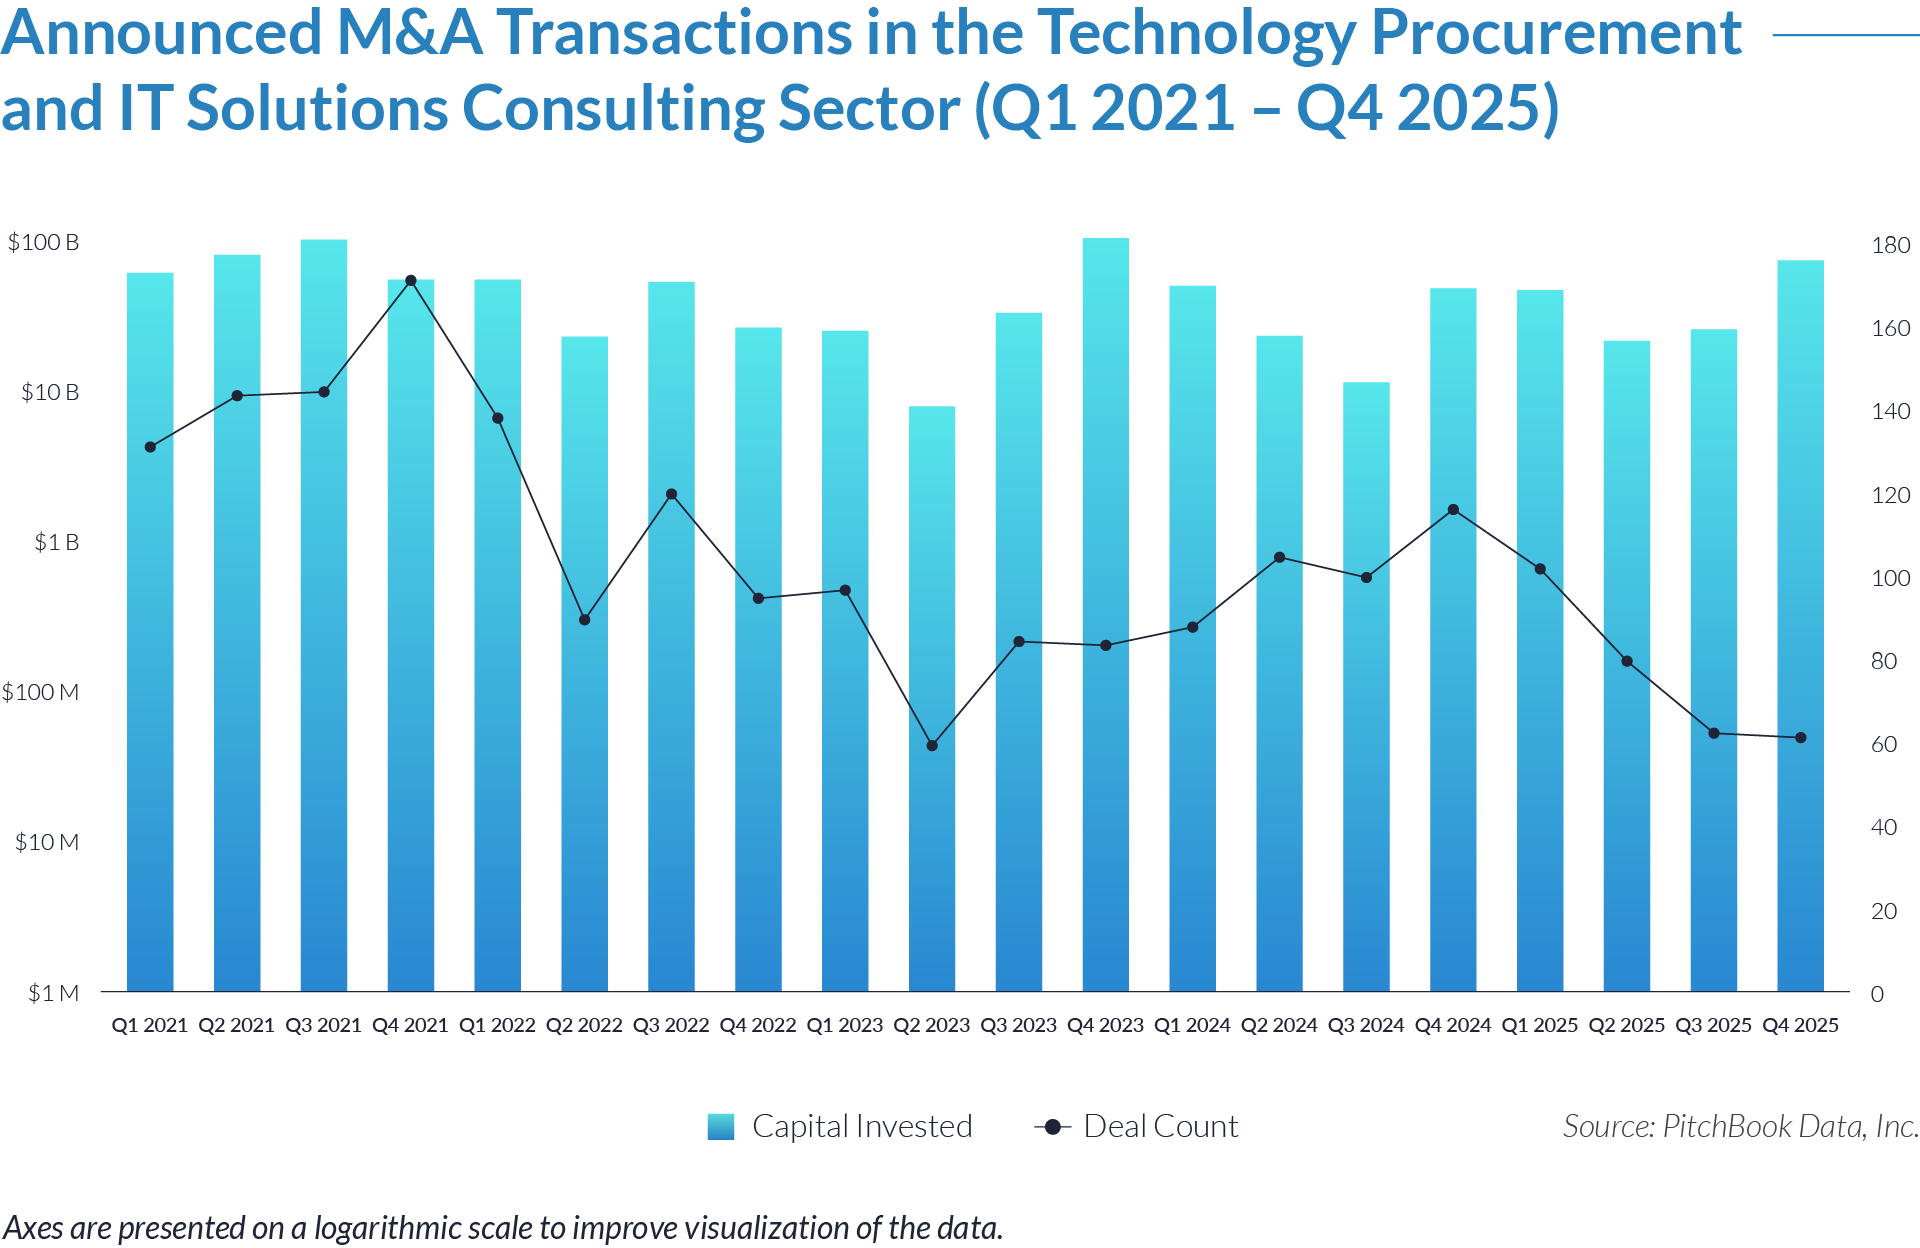
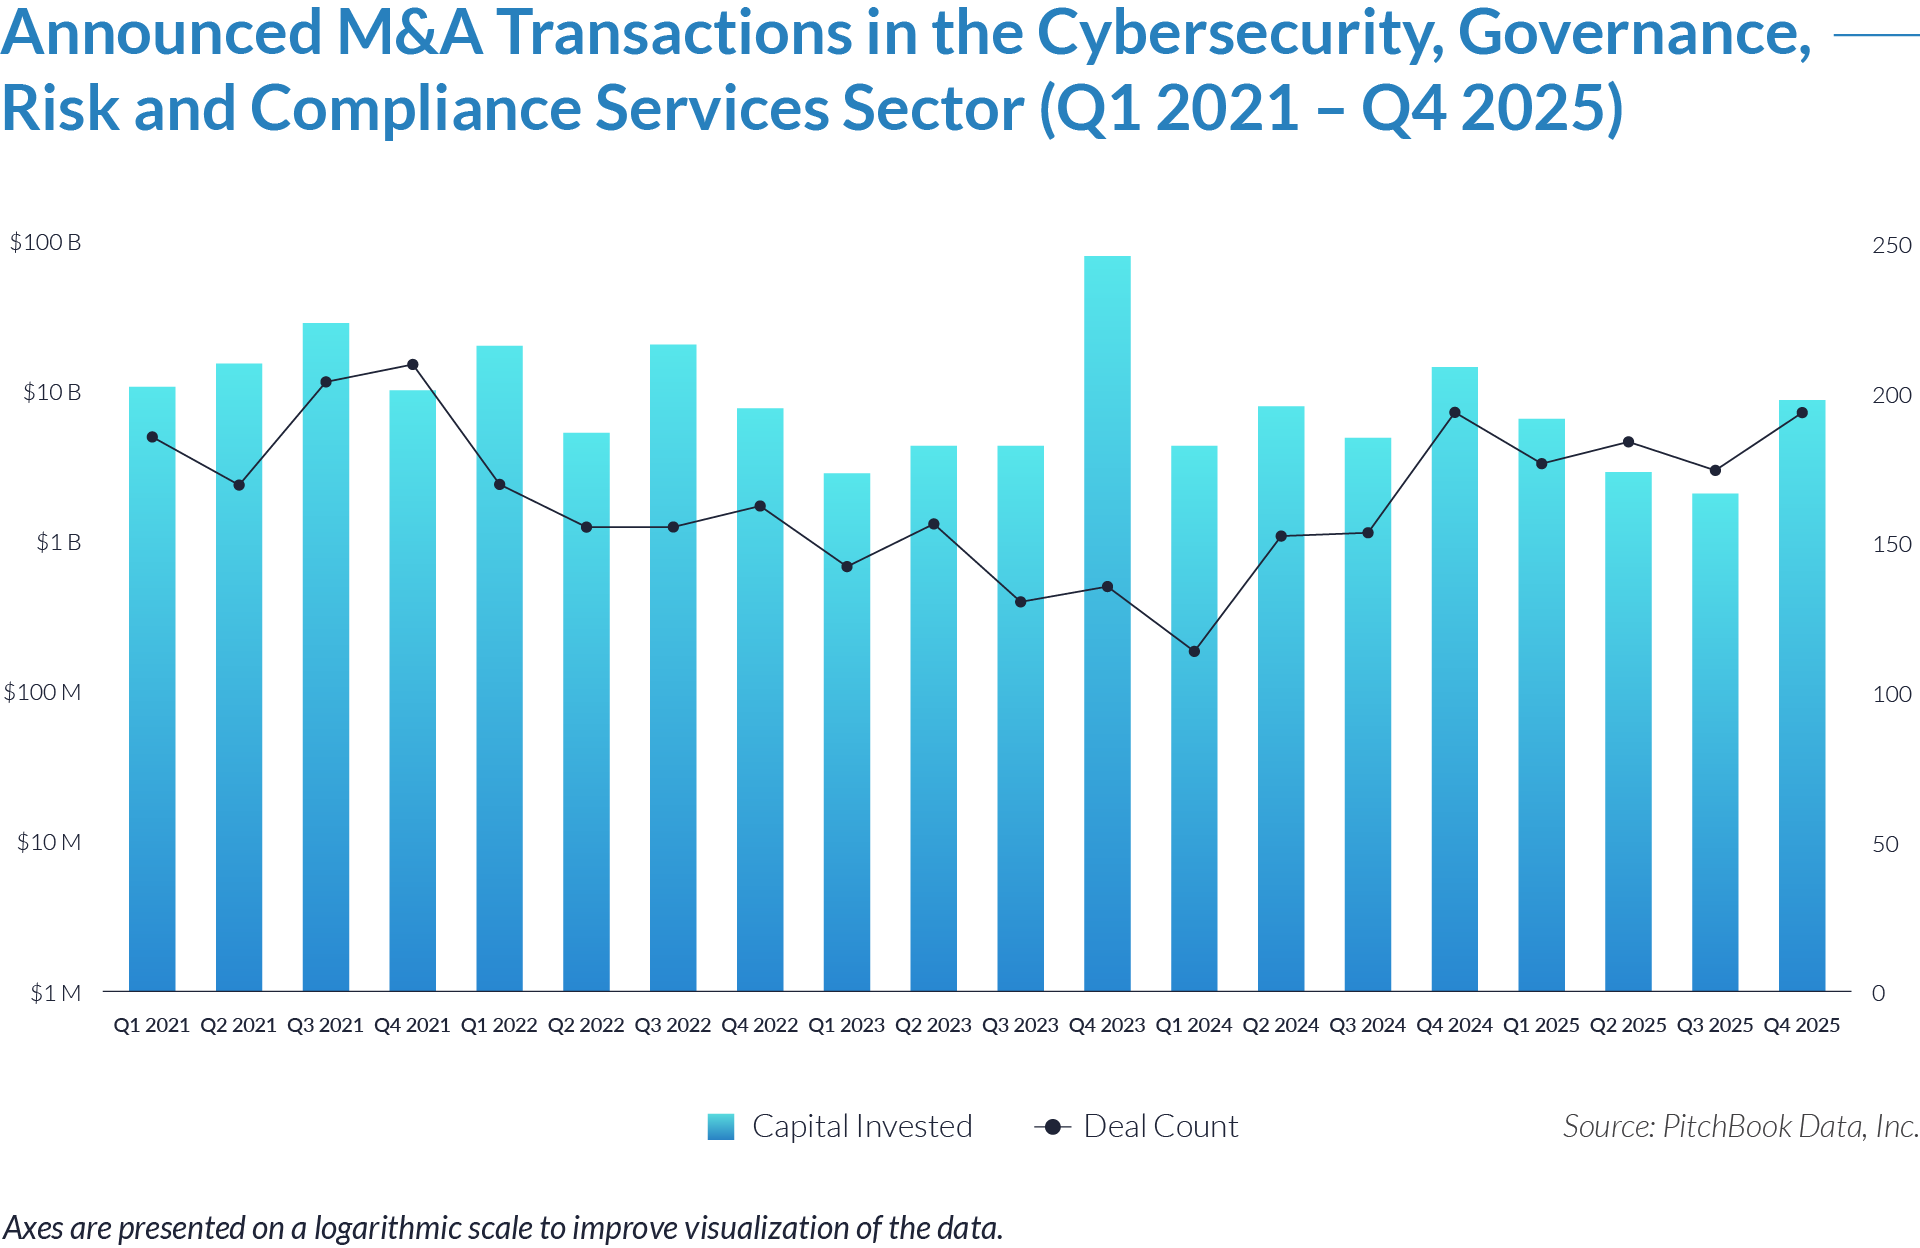
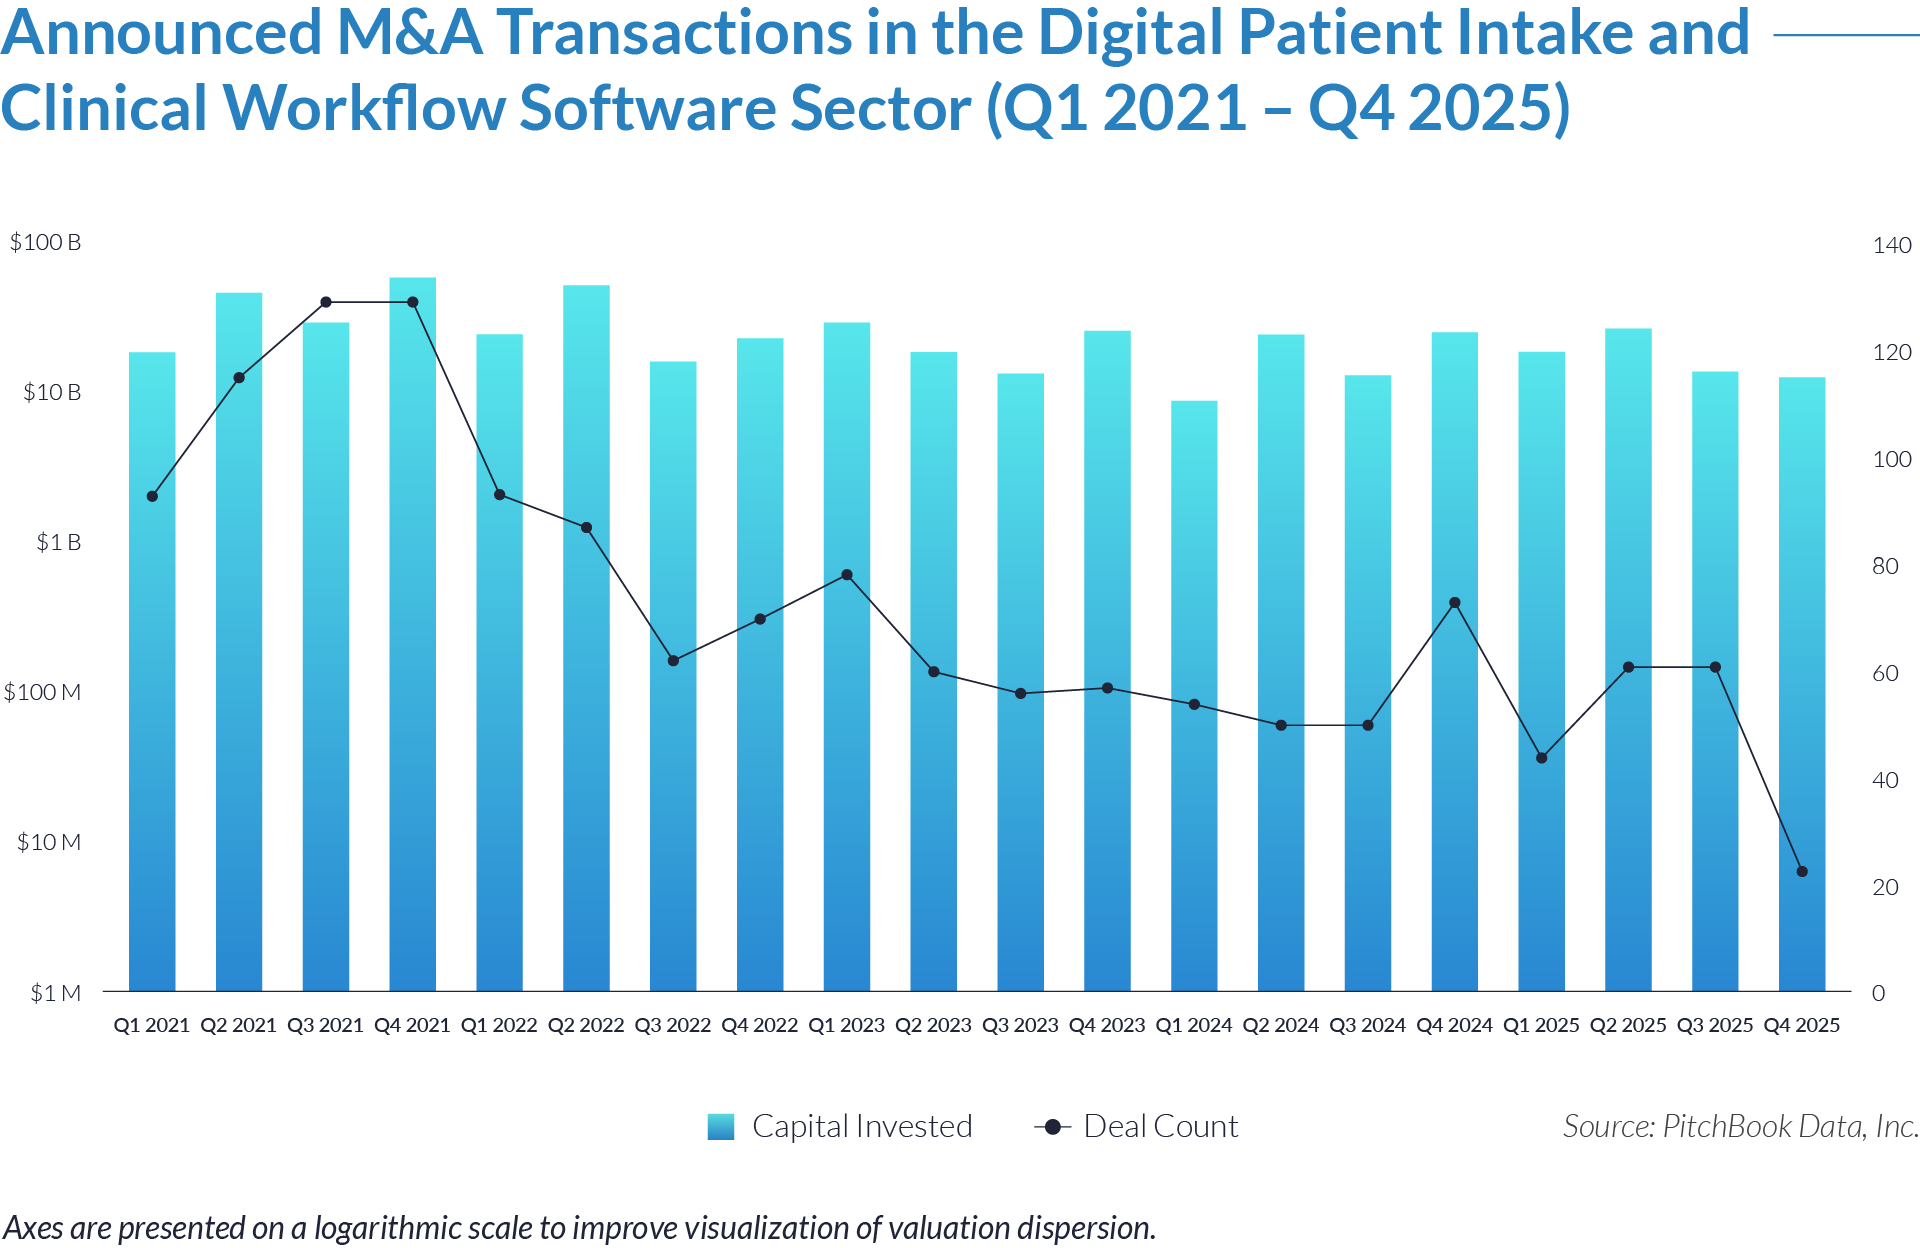
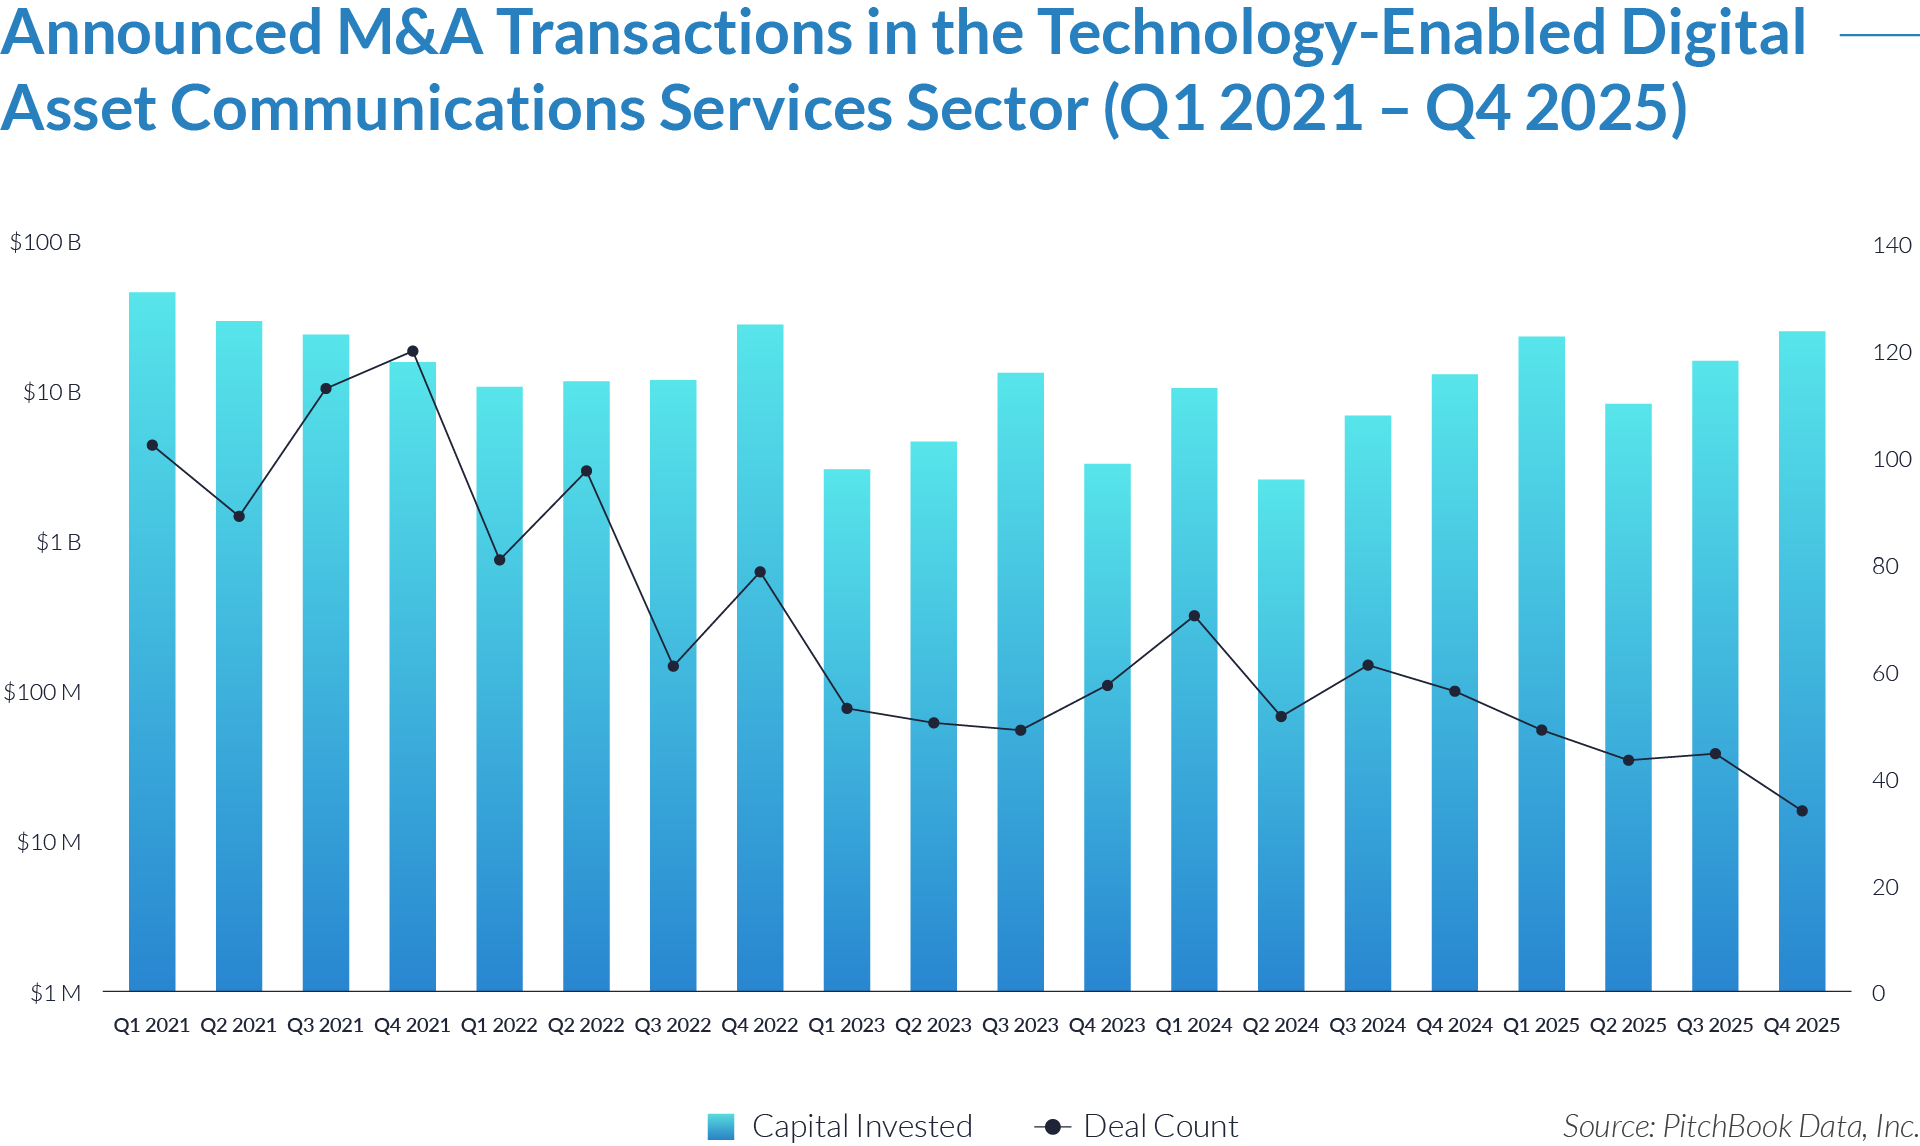
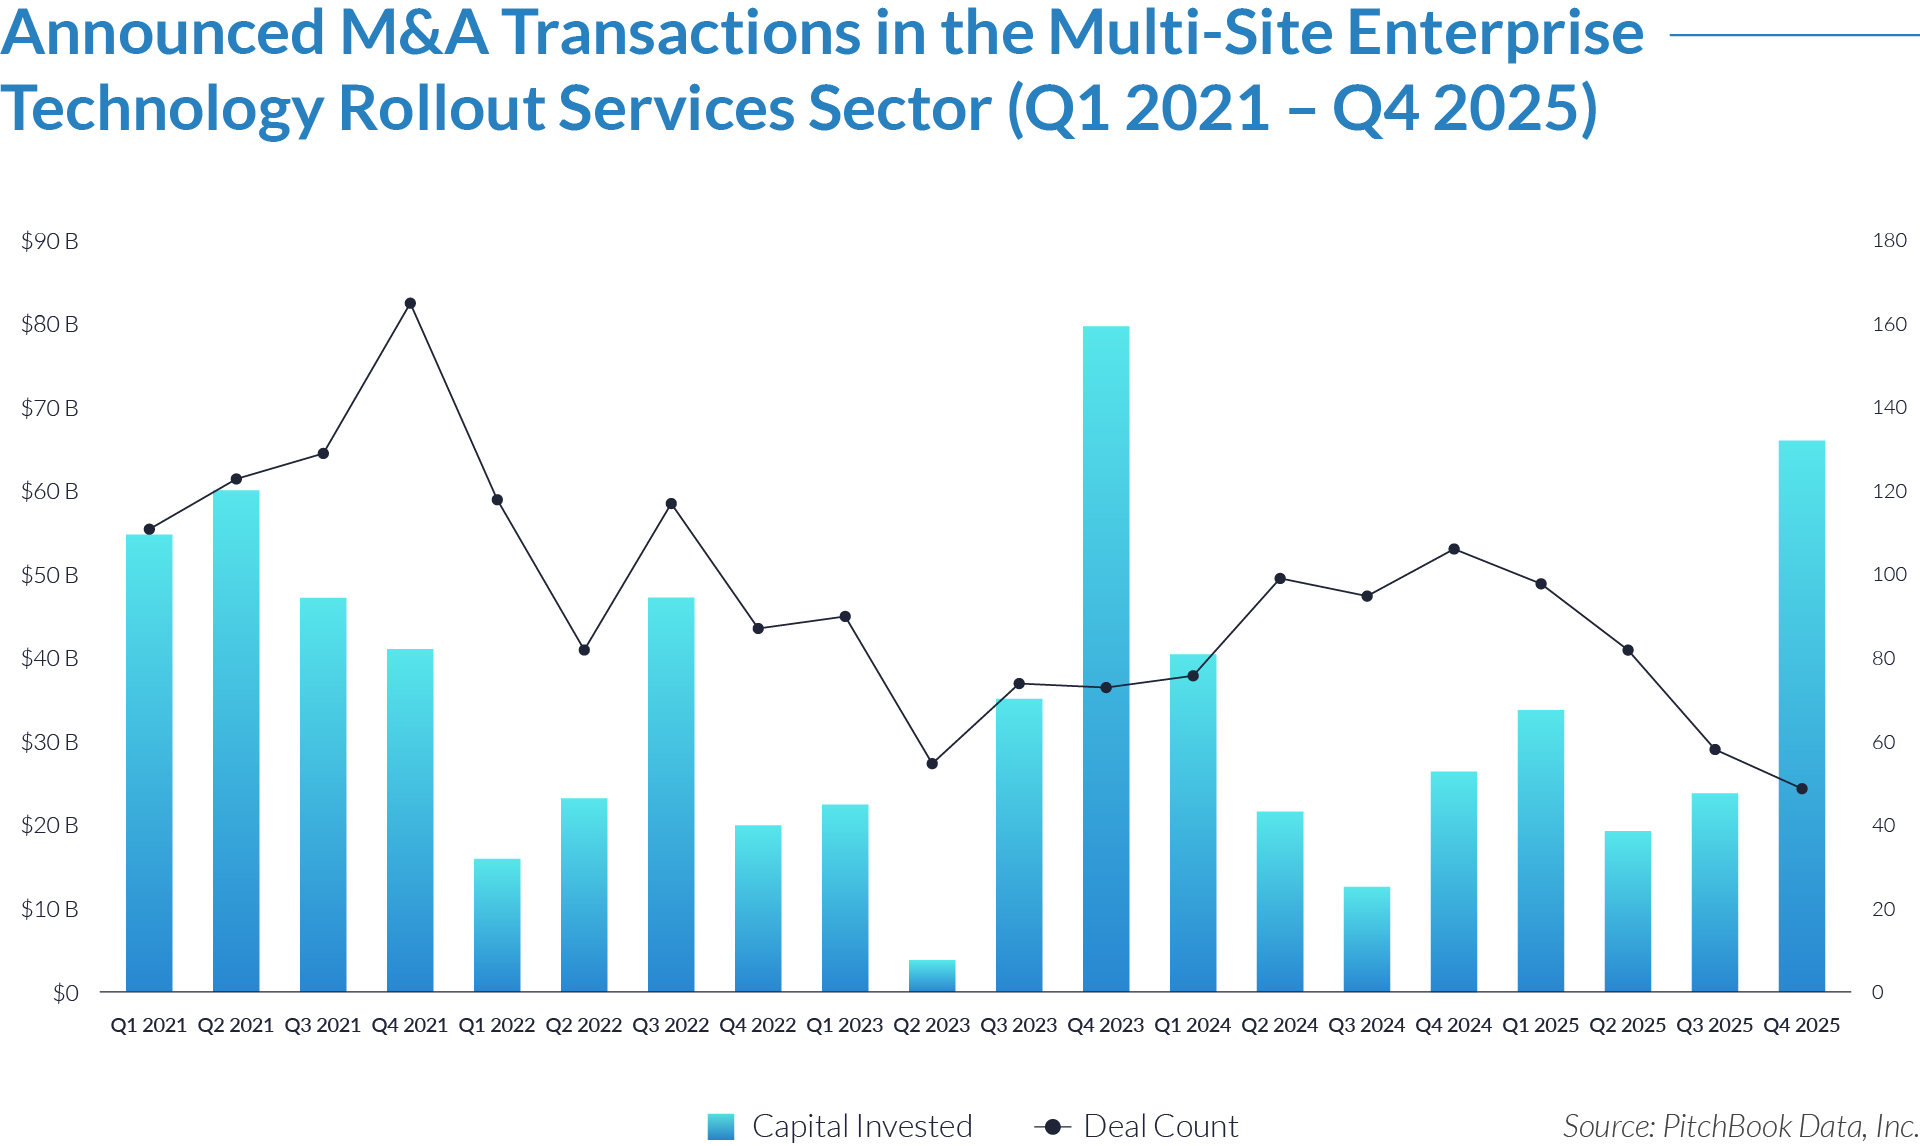
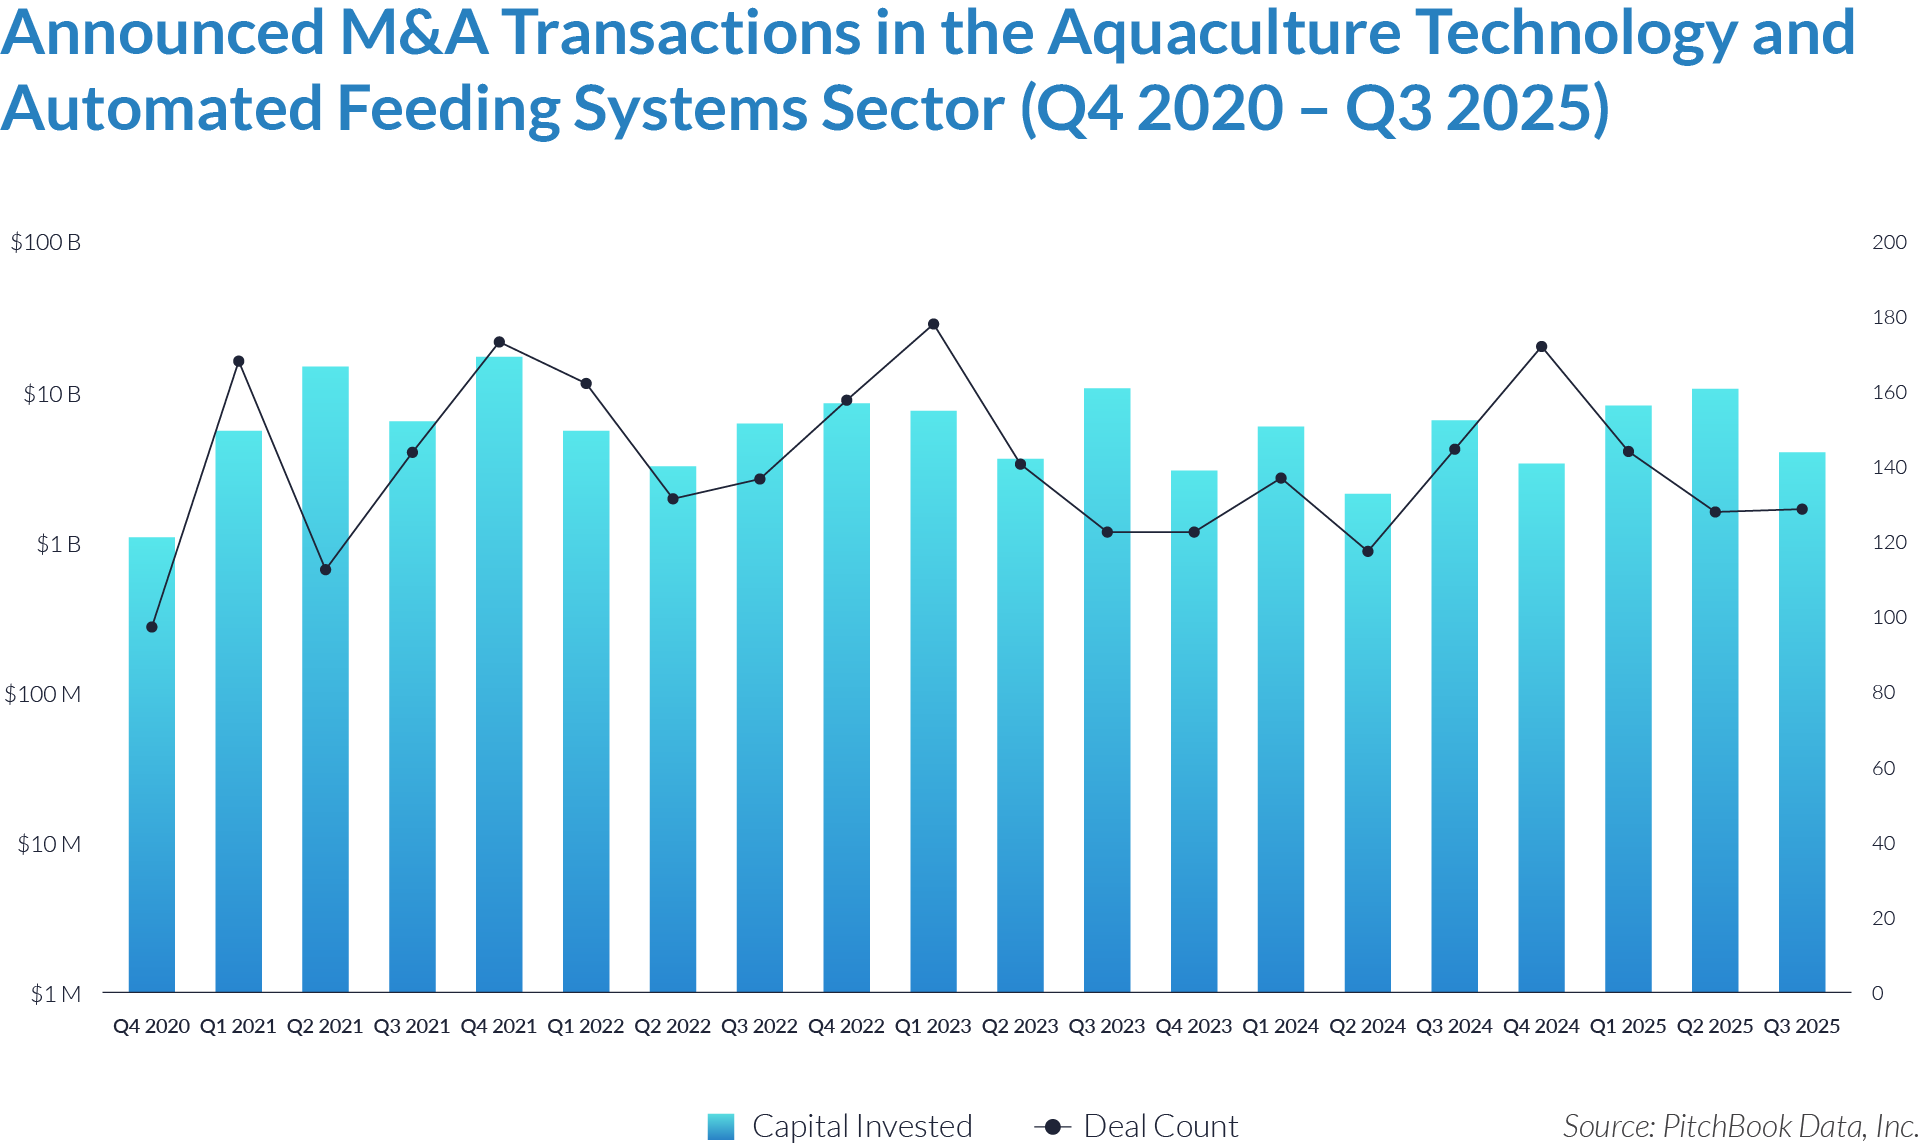
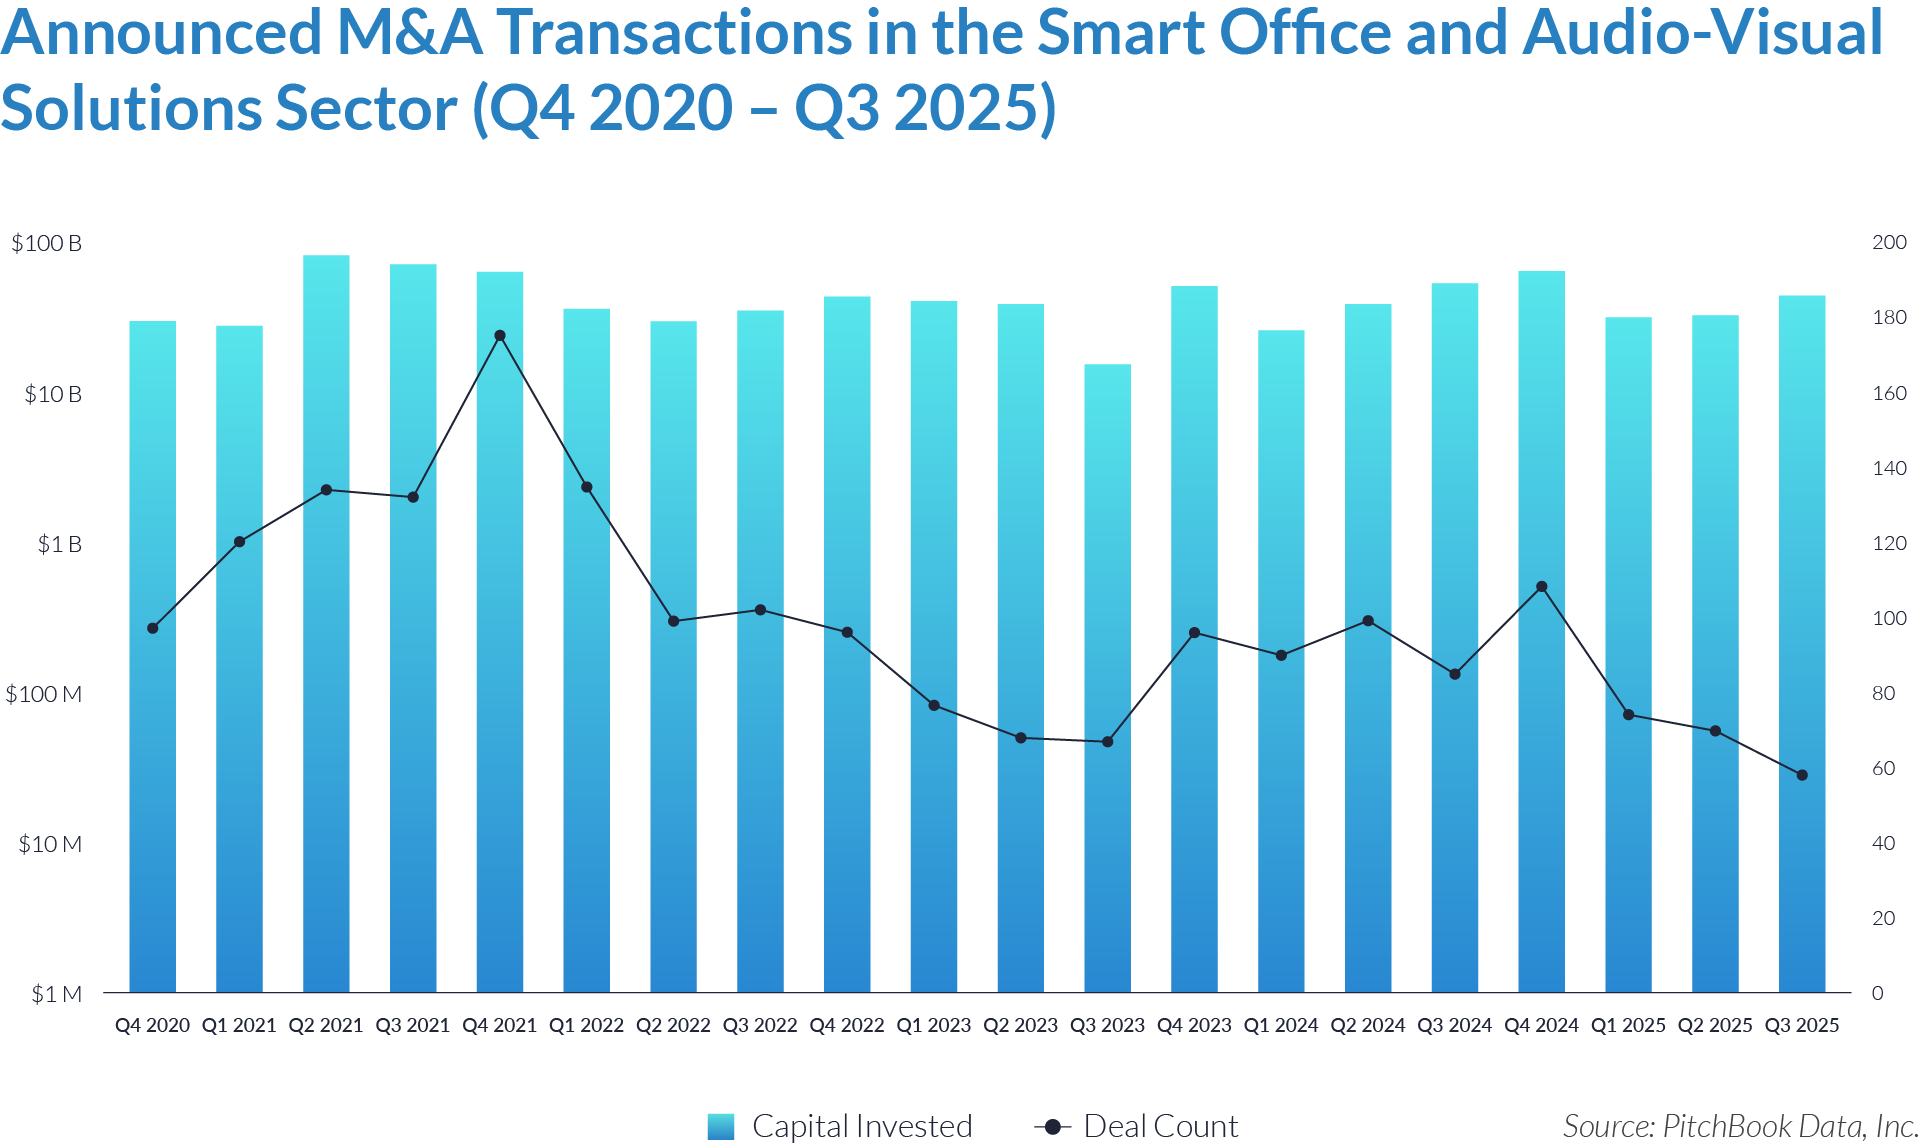
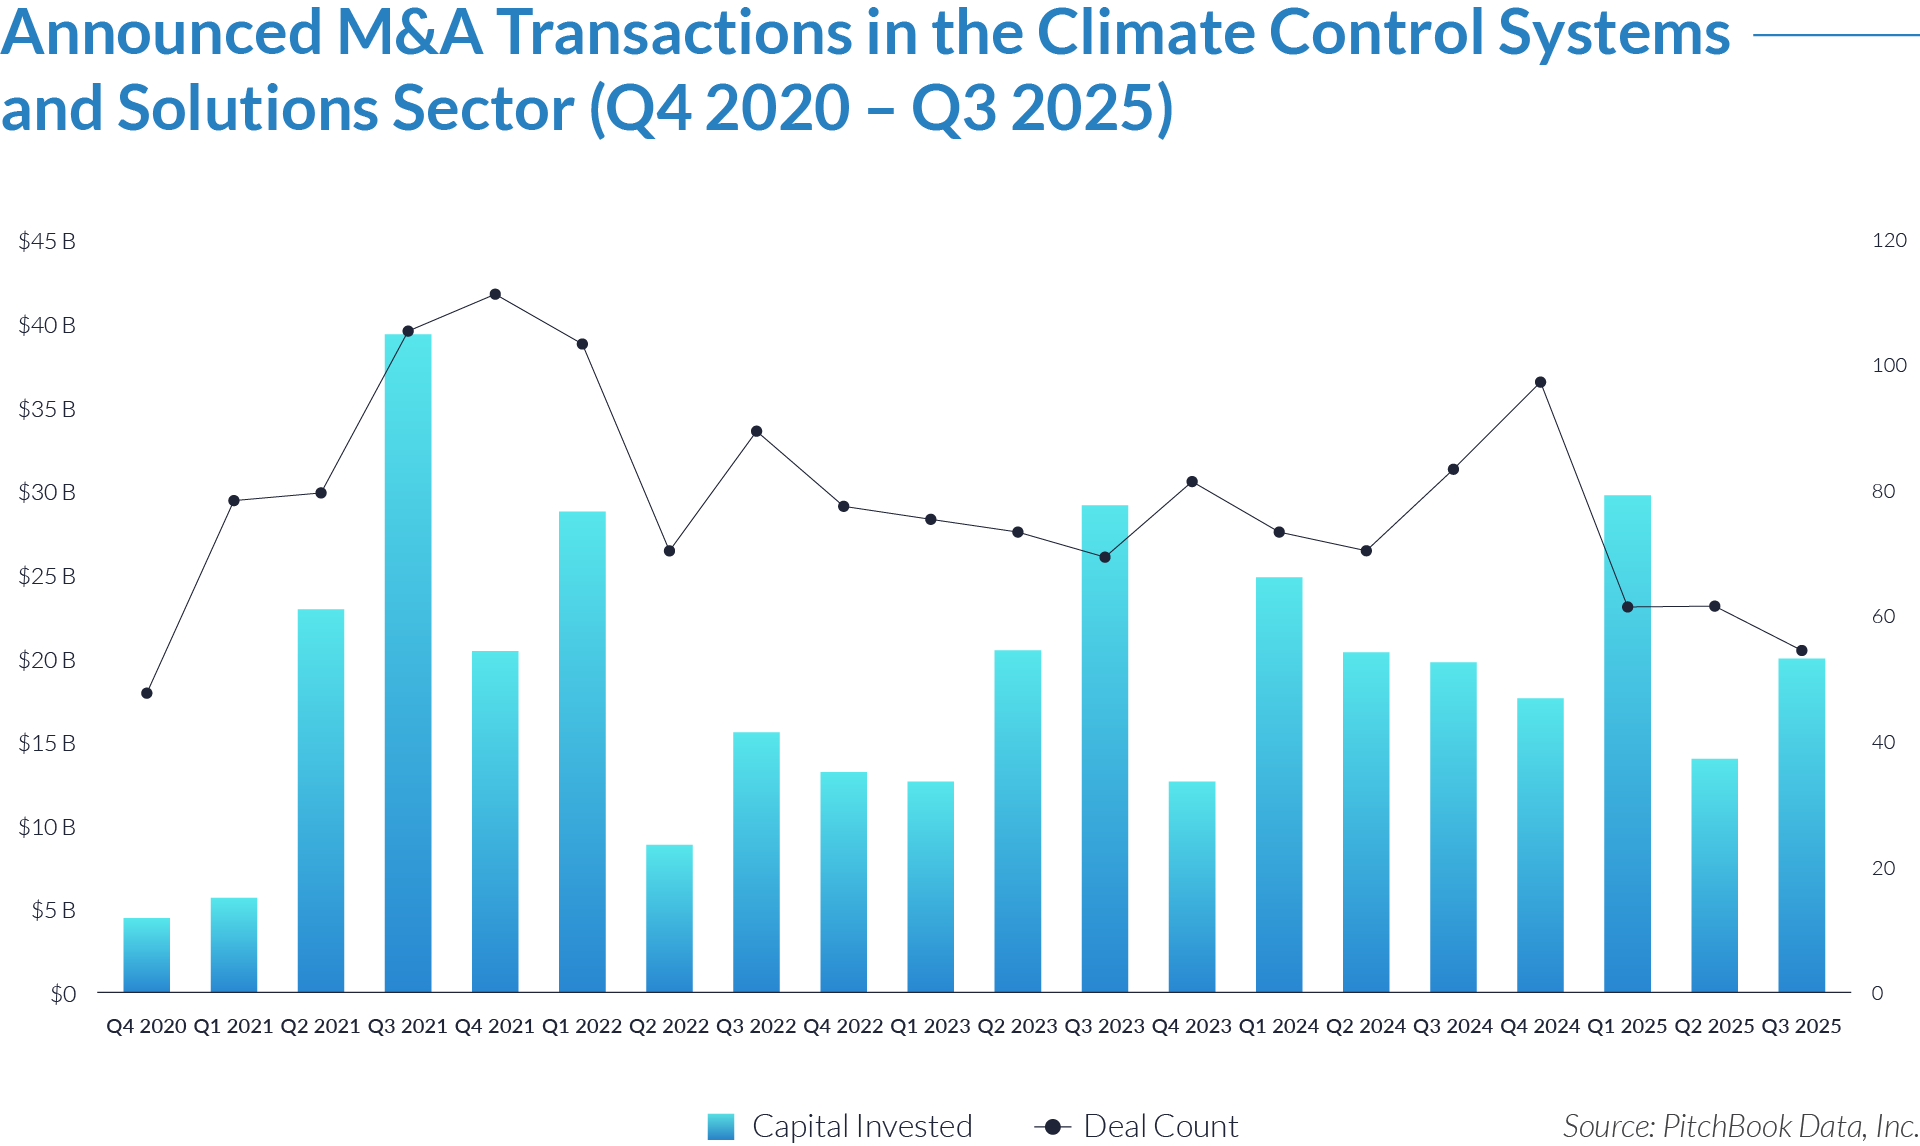
- Over the 20-quarter period, the sector recorded approximately $74 billion of total capital invested across 3,899 transactions, reflecting sustained deal activity and continued investor interest in staffing and workforce solutions platforms supporting core end markets. The high transaction volume underscores the sector’s fragmented nature and the prevalence of smaller, add-on acquisitions.
- Deal activity remained consistently elevated, averaging 195 transactions per quarter, reflecting ongoing consolidation across a highly fragmented provider base and continued demand for outsourced labor and workforce solutions tied to long-duration energy and infrastructure project pipelines. Despite fluctuations in capital deployment, transaction volumes remained relatively stable, indicating steady underlying M&A demand.
- Capital deployment exhibited significant quarterly volatility, with notable spikes in Q4 2021 ($10 billion) and Q2 2022 ($12 billion), suggesting that large platform acquisitions or sponsor-led transactions periodically drove outsized capital investment. In contrast, several quarters in 2023 recorded below $1.5 billion investment levels, reflecting a more cautious capital environment and normalization following peak valuation conditions.
- Recent periods (2024–2025) indicate a selective recovery in capital deployment alongside stable deal volumes, with multiple quarters exceeding $4 billion – $5 billion of investment. This trend suggests a shift toward fewer, larger transactions targeting scaled platforms with diversified client exposure, recurring contractor demand, and stronger positioning within energy transition and infrastructure development themes.
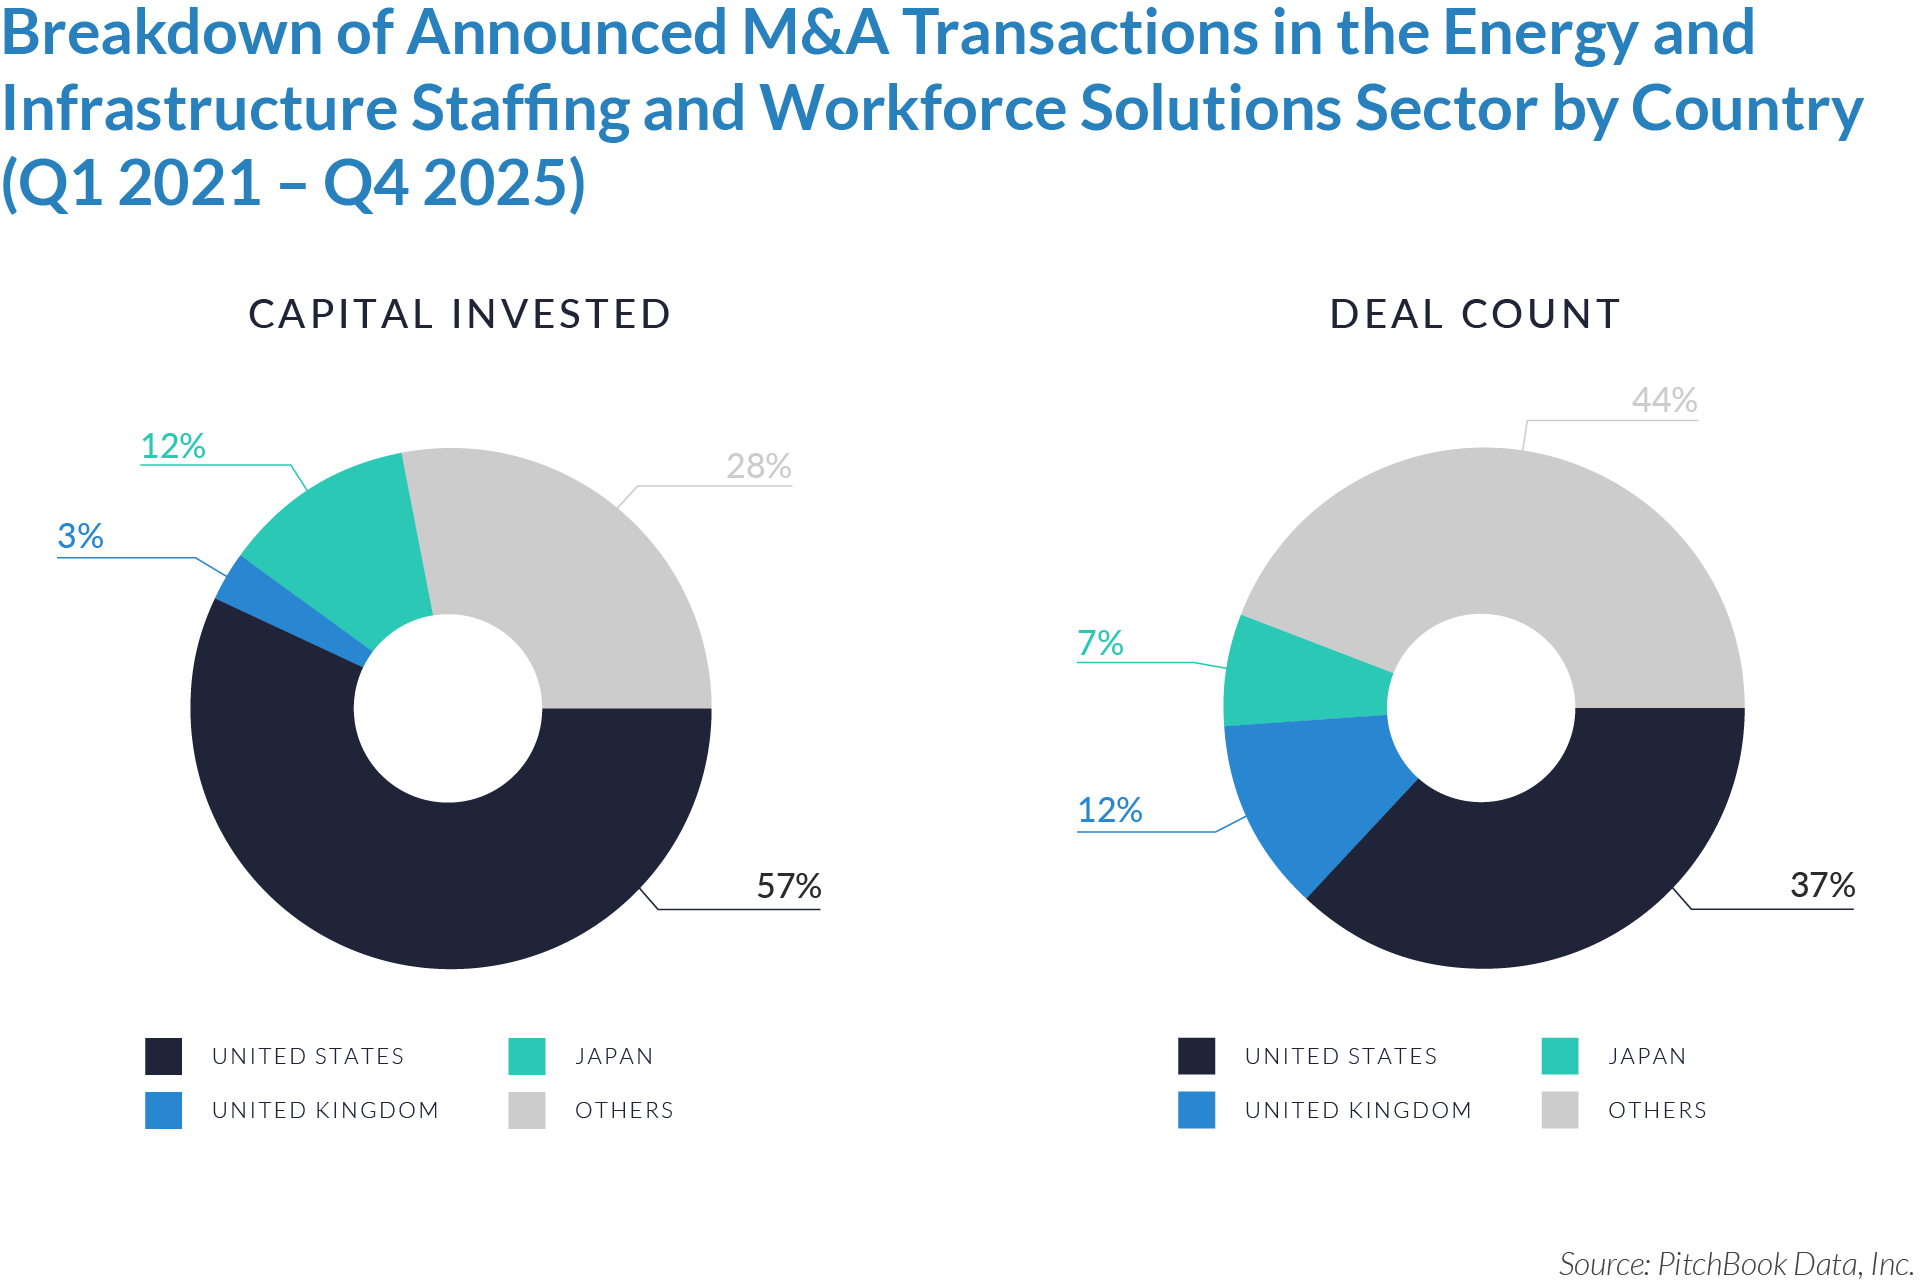
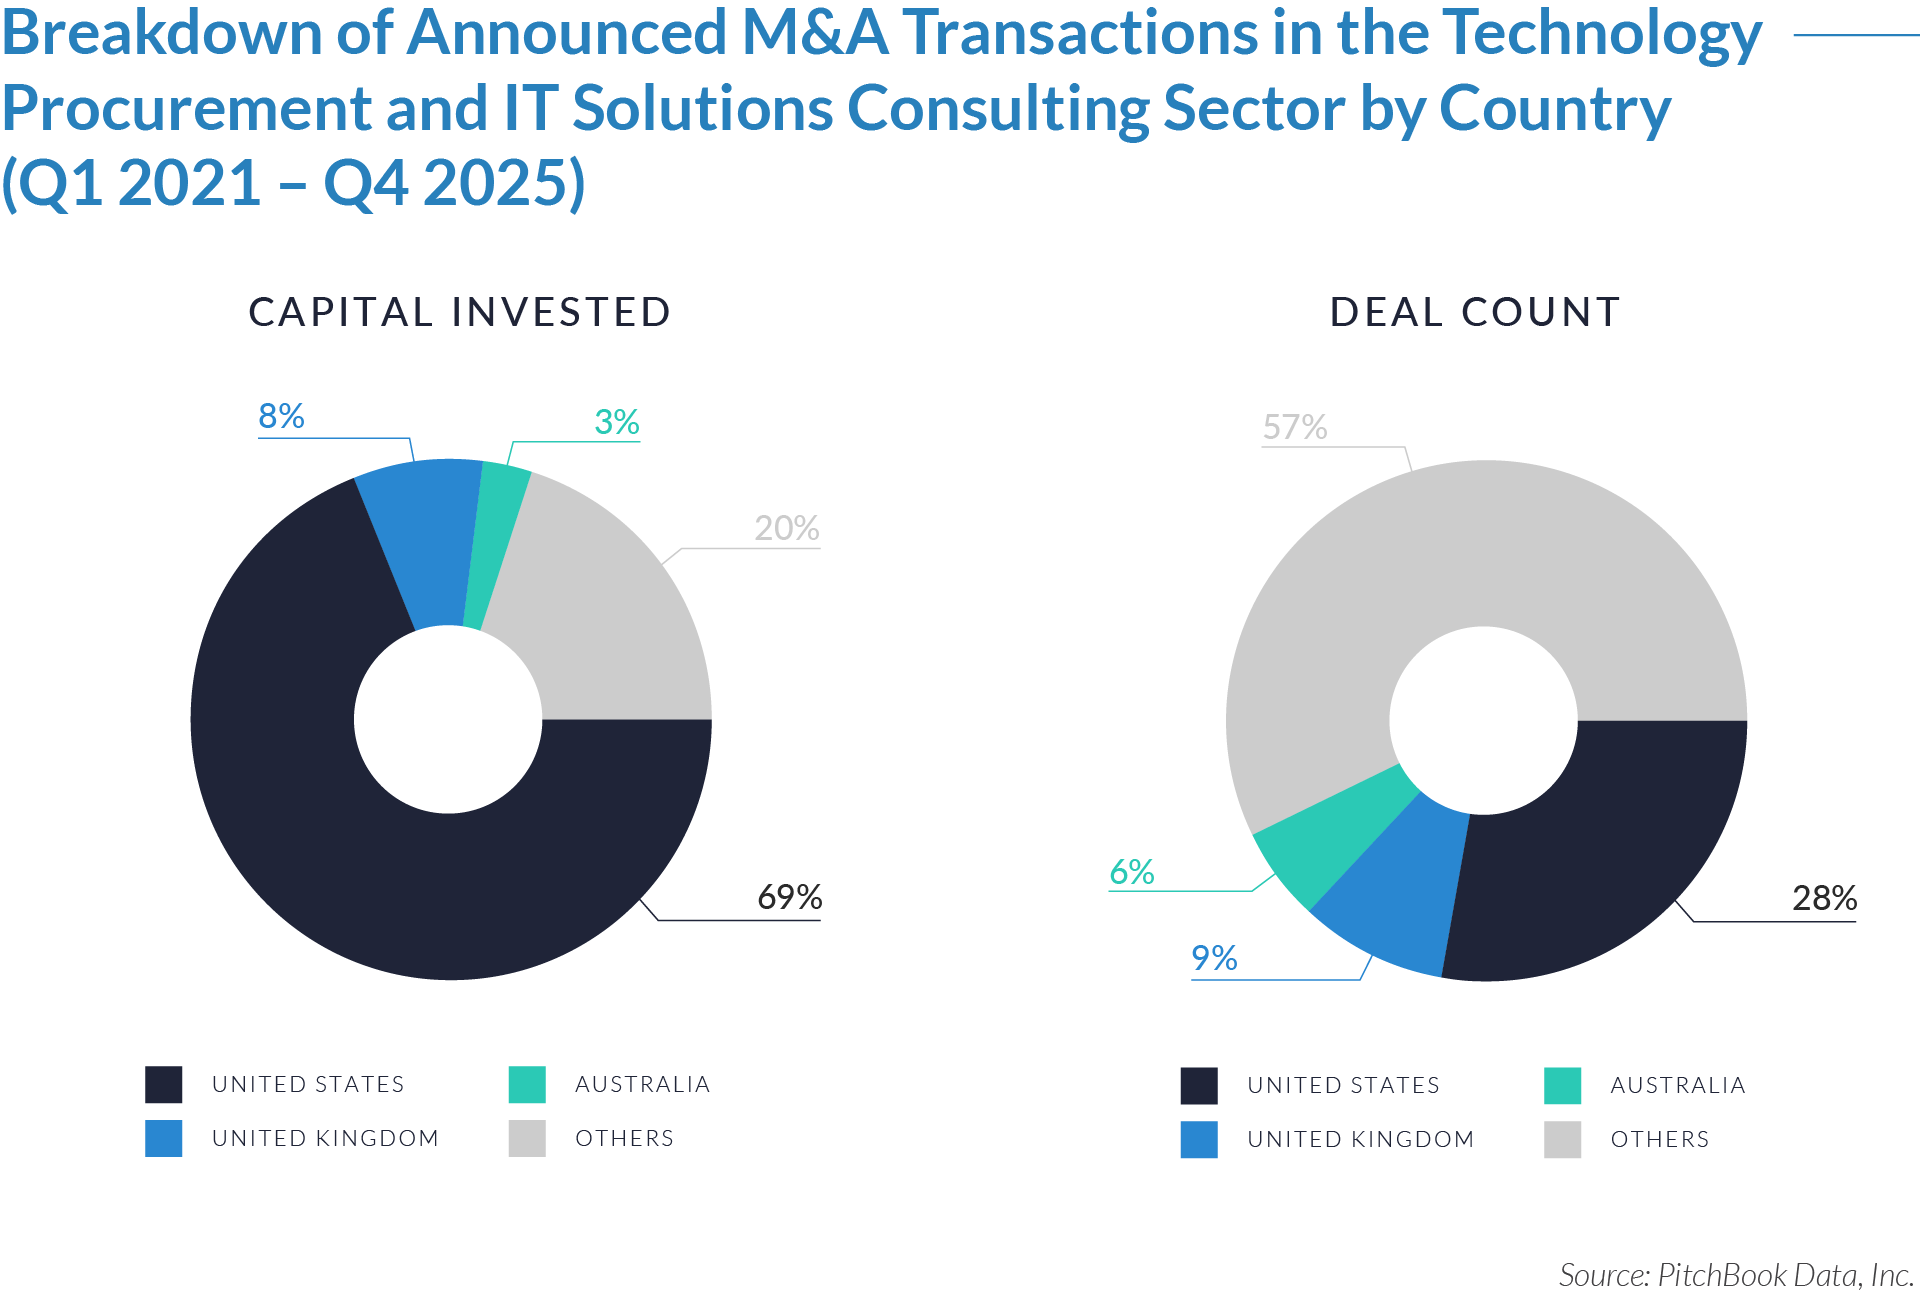
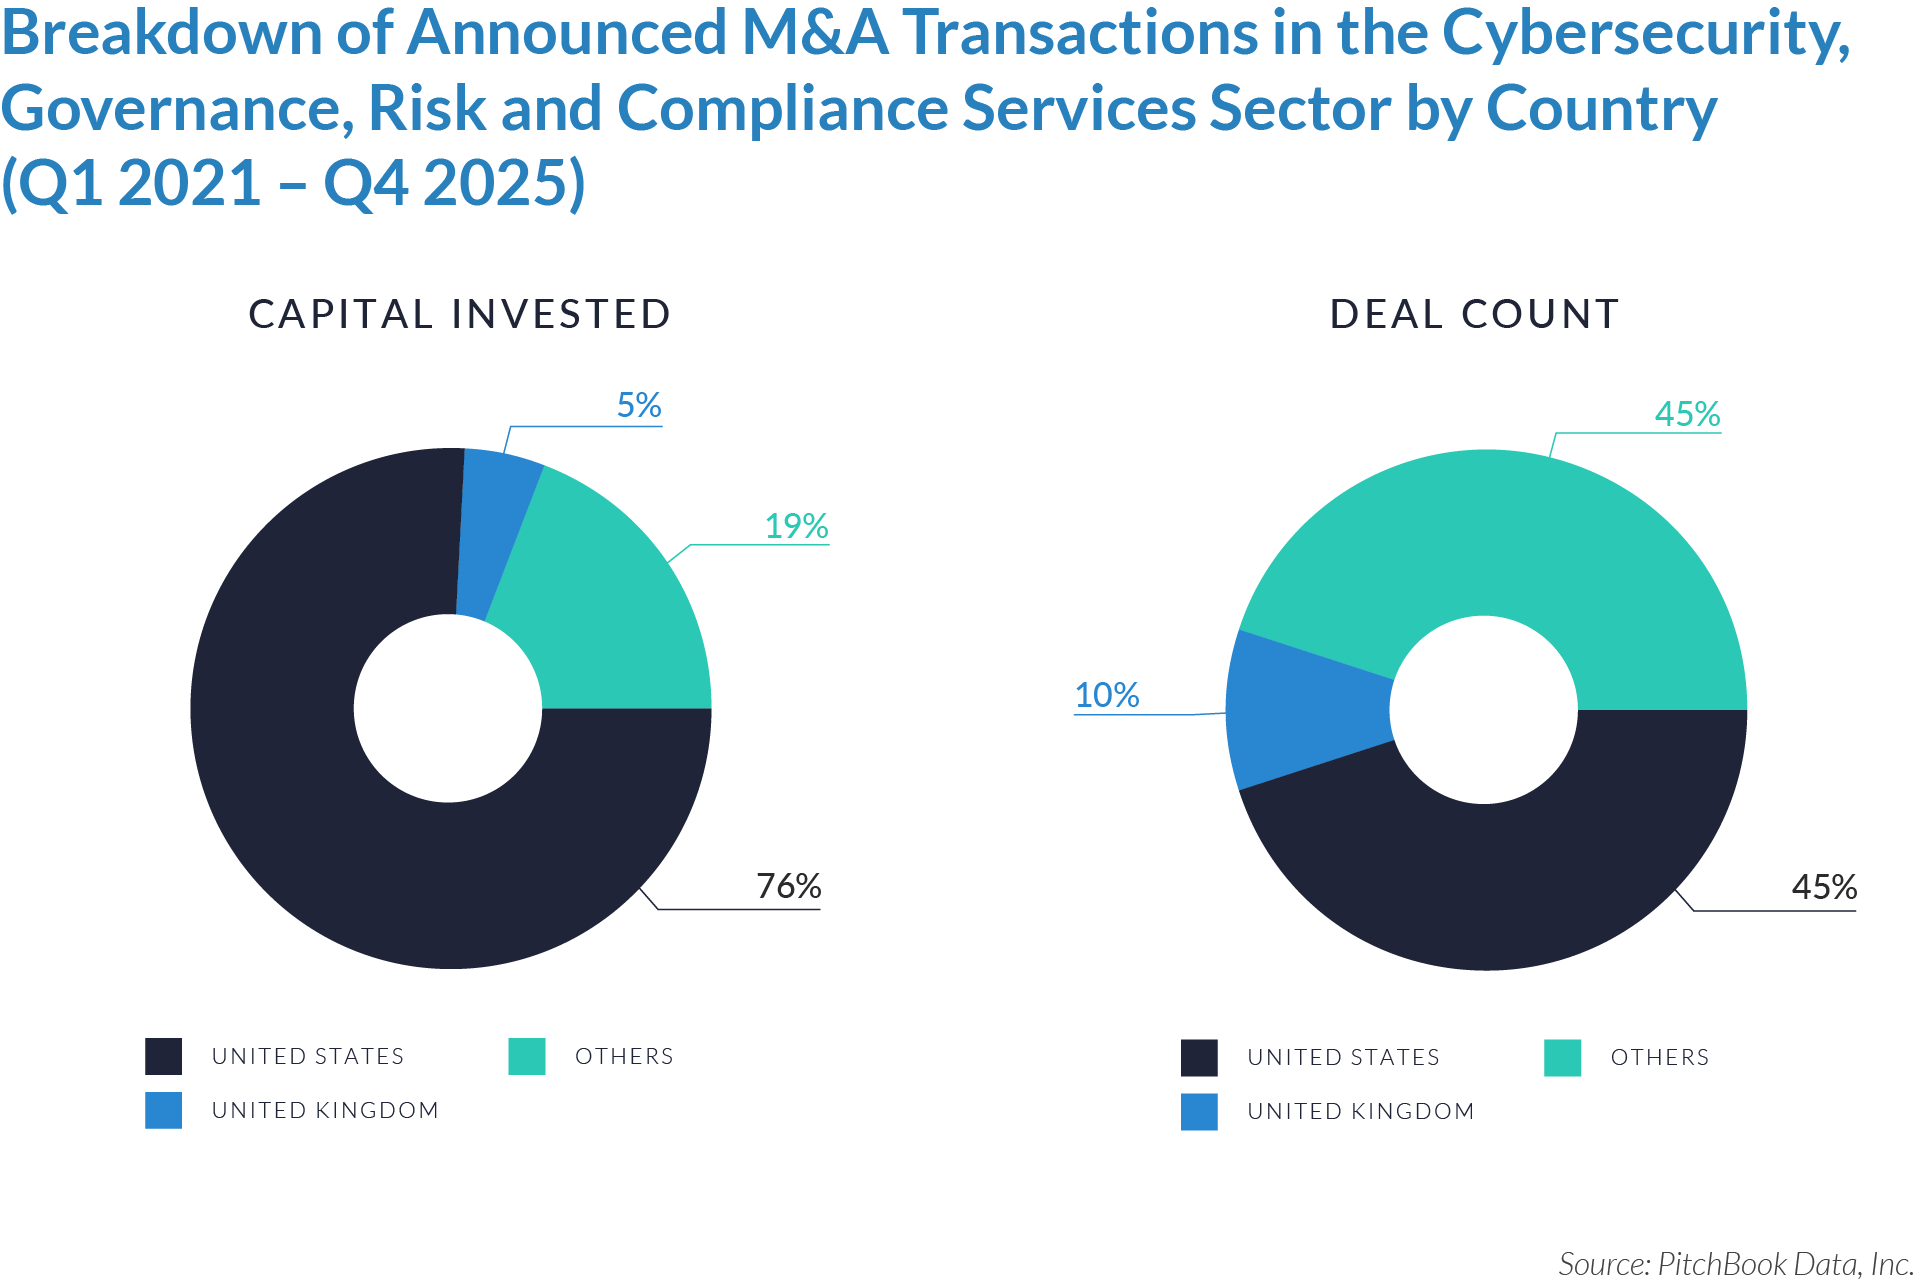
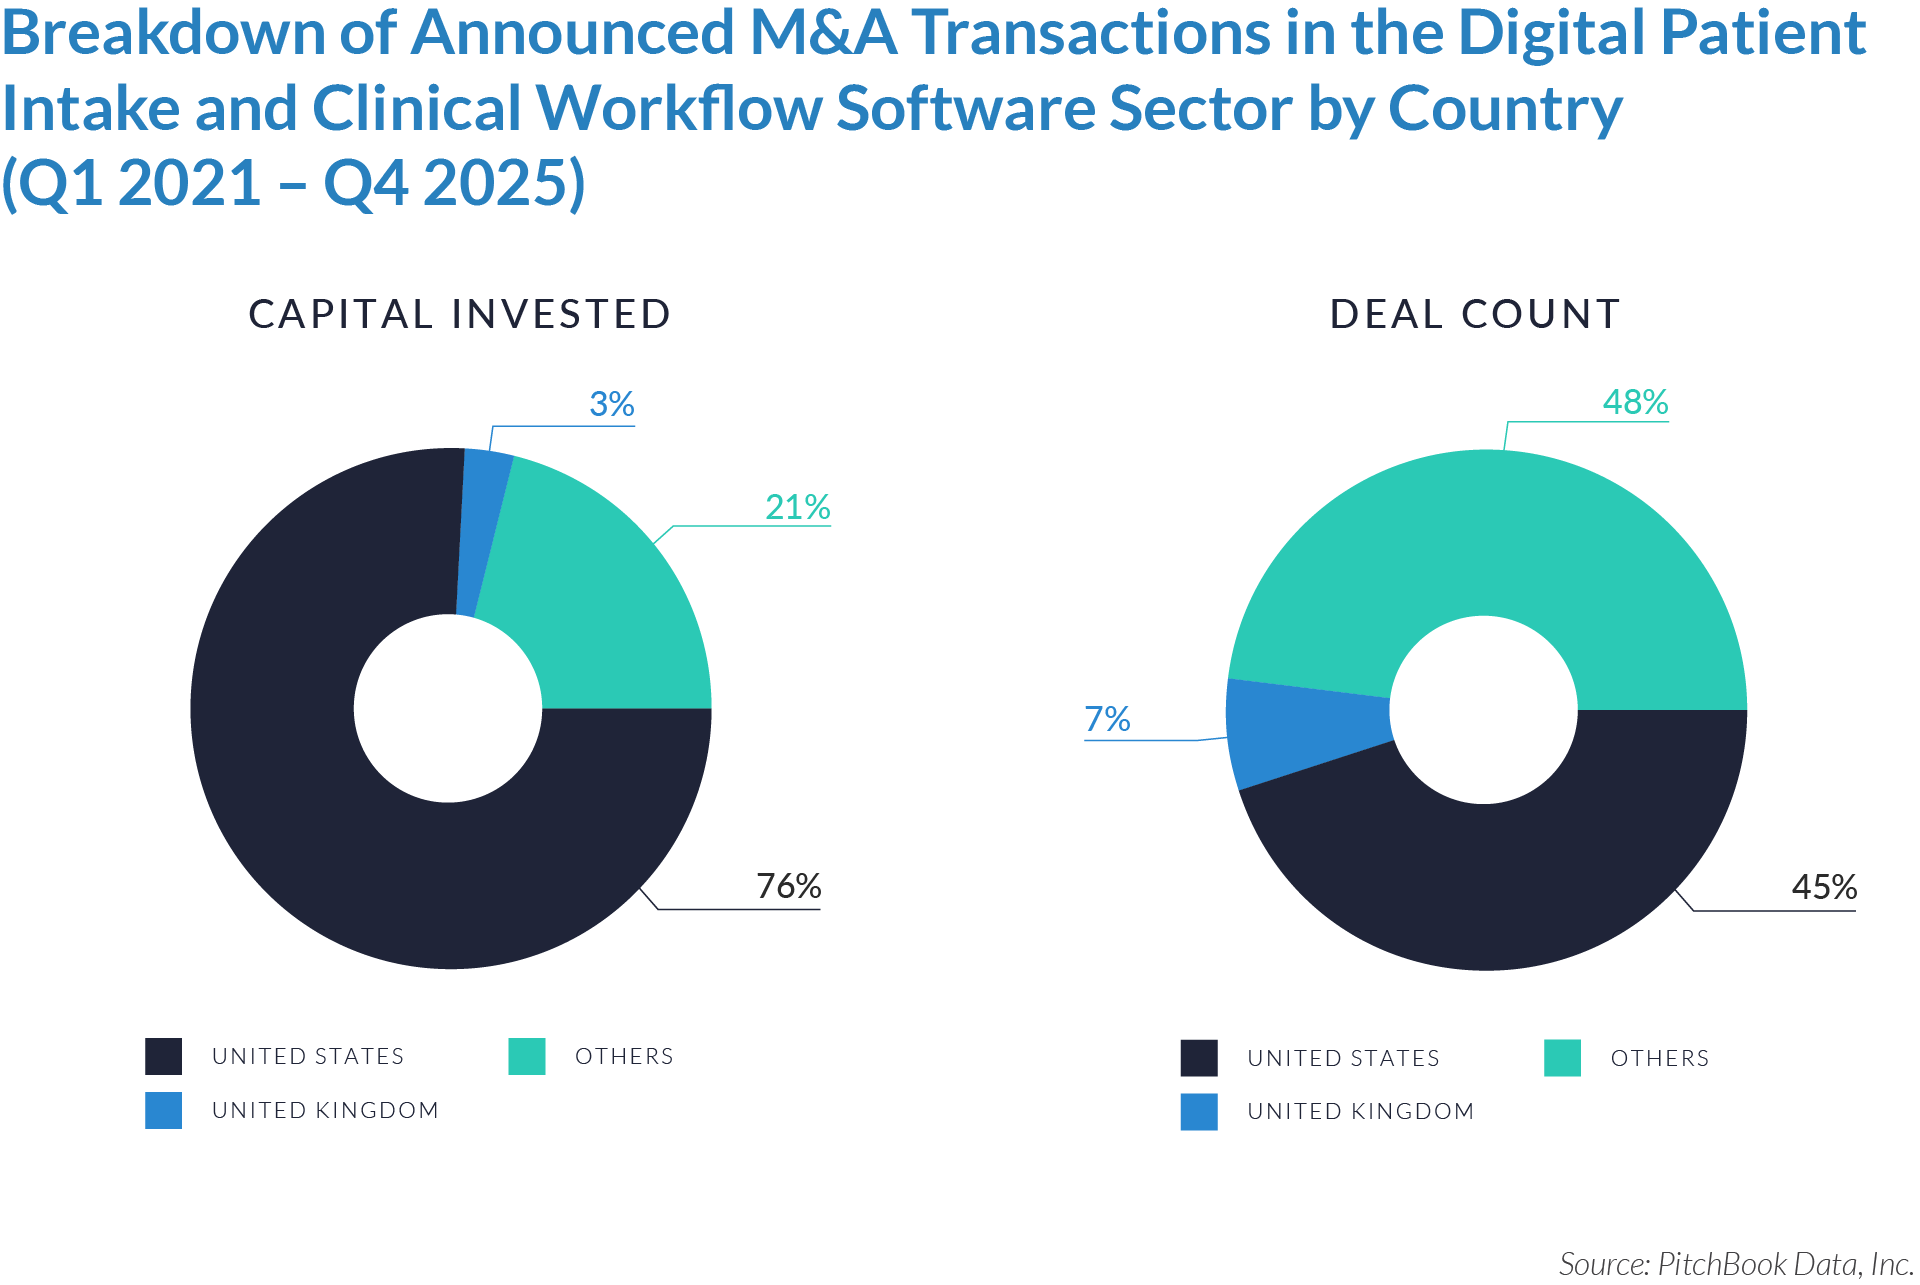
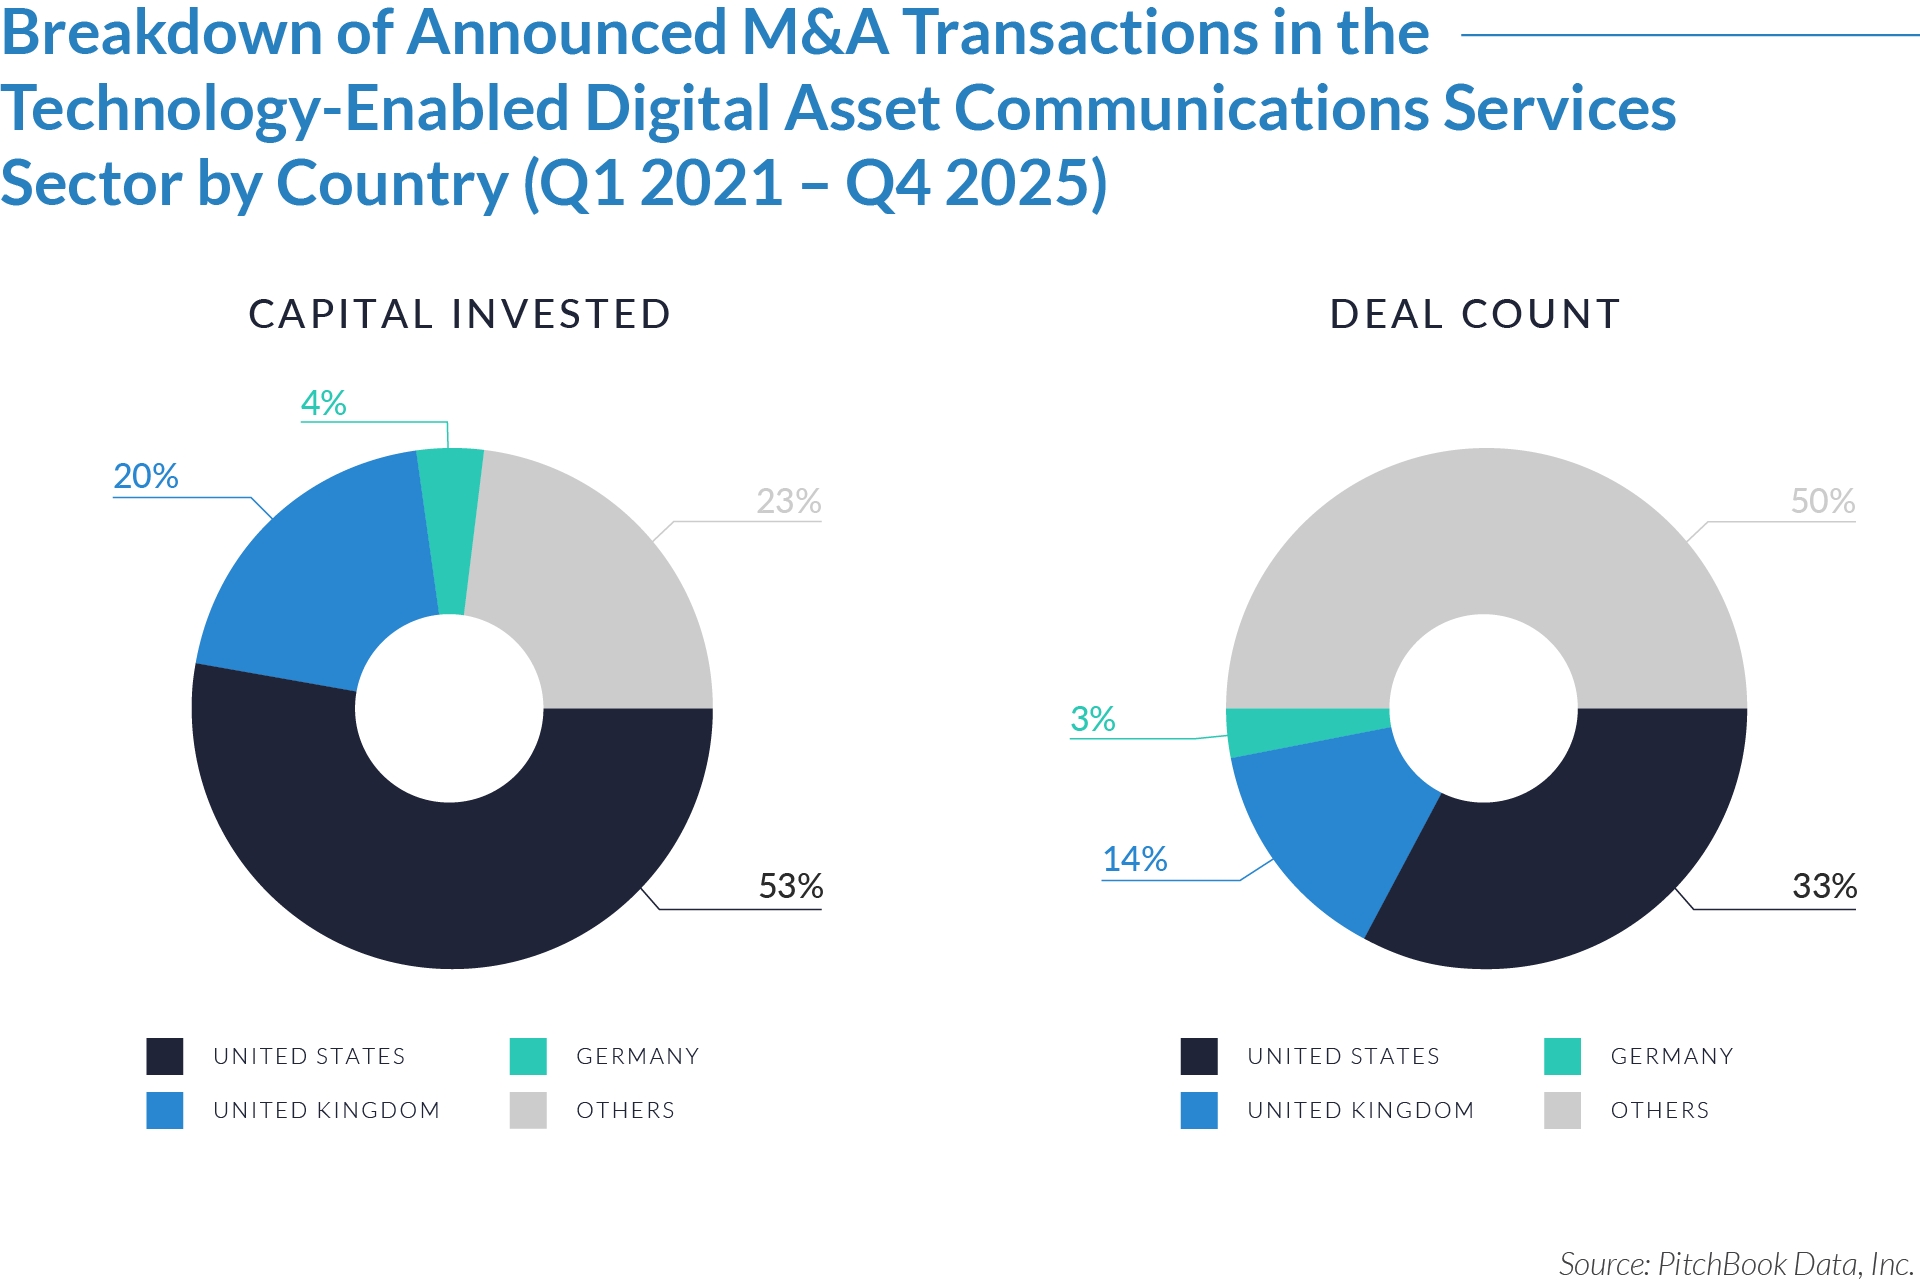
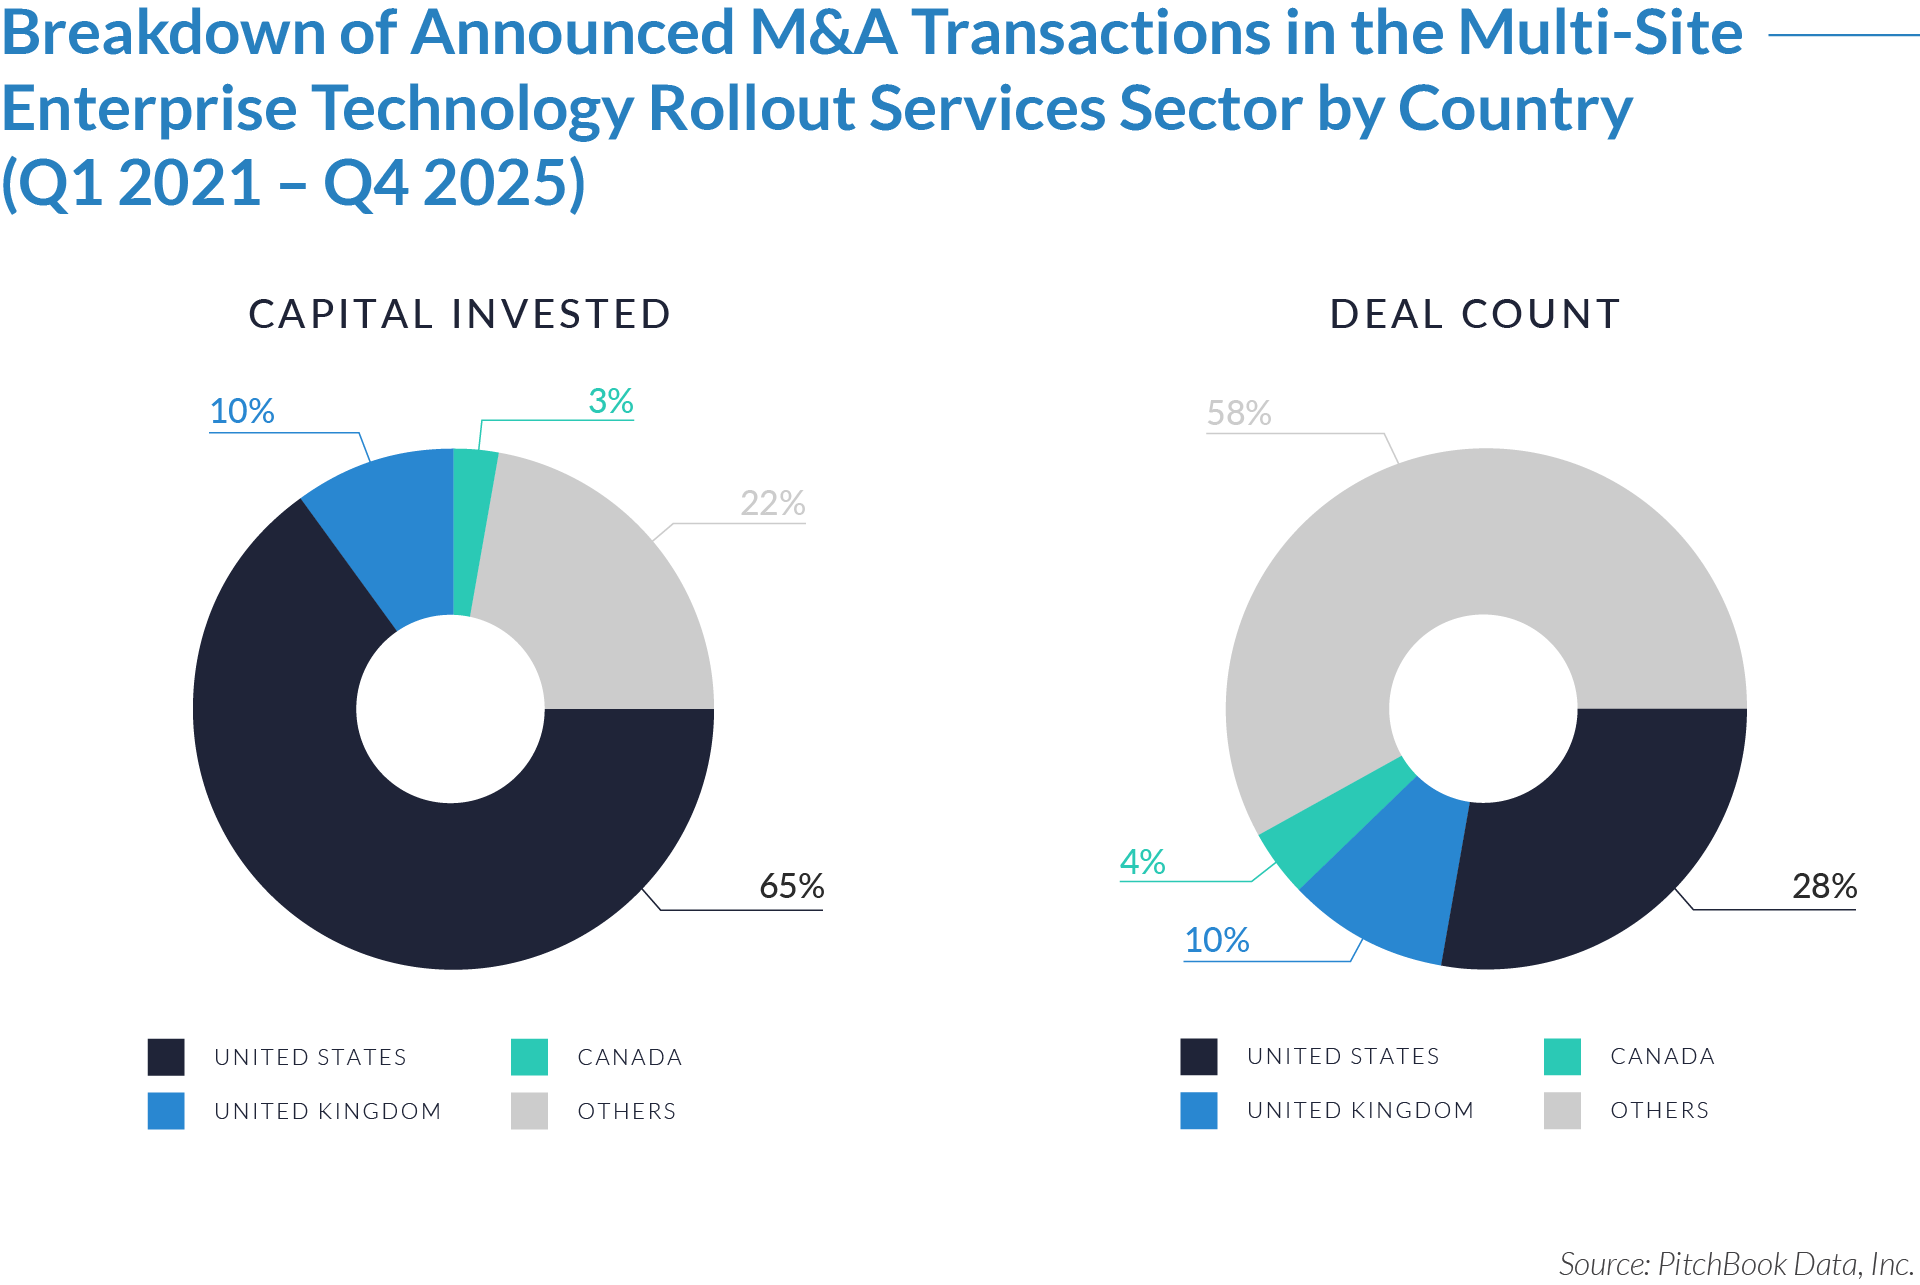
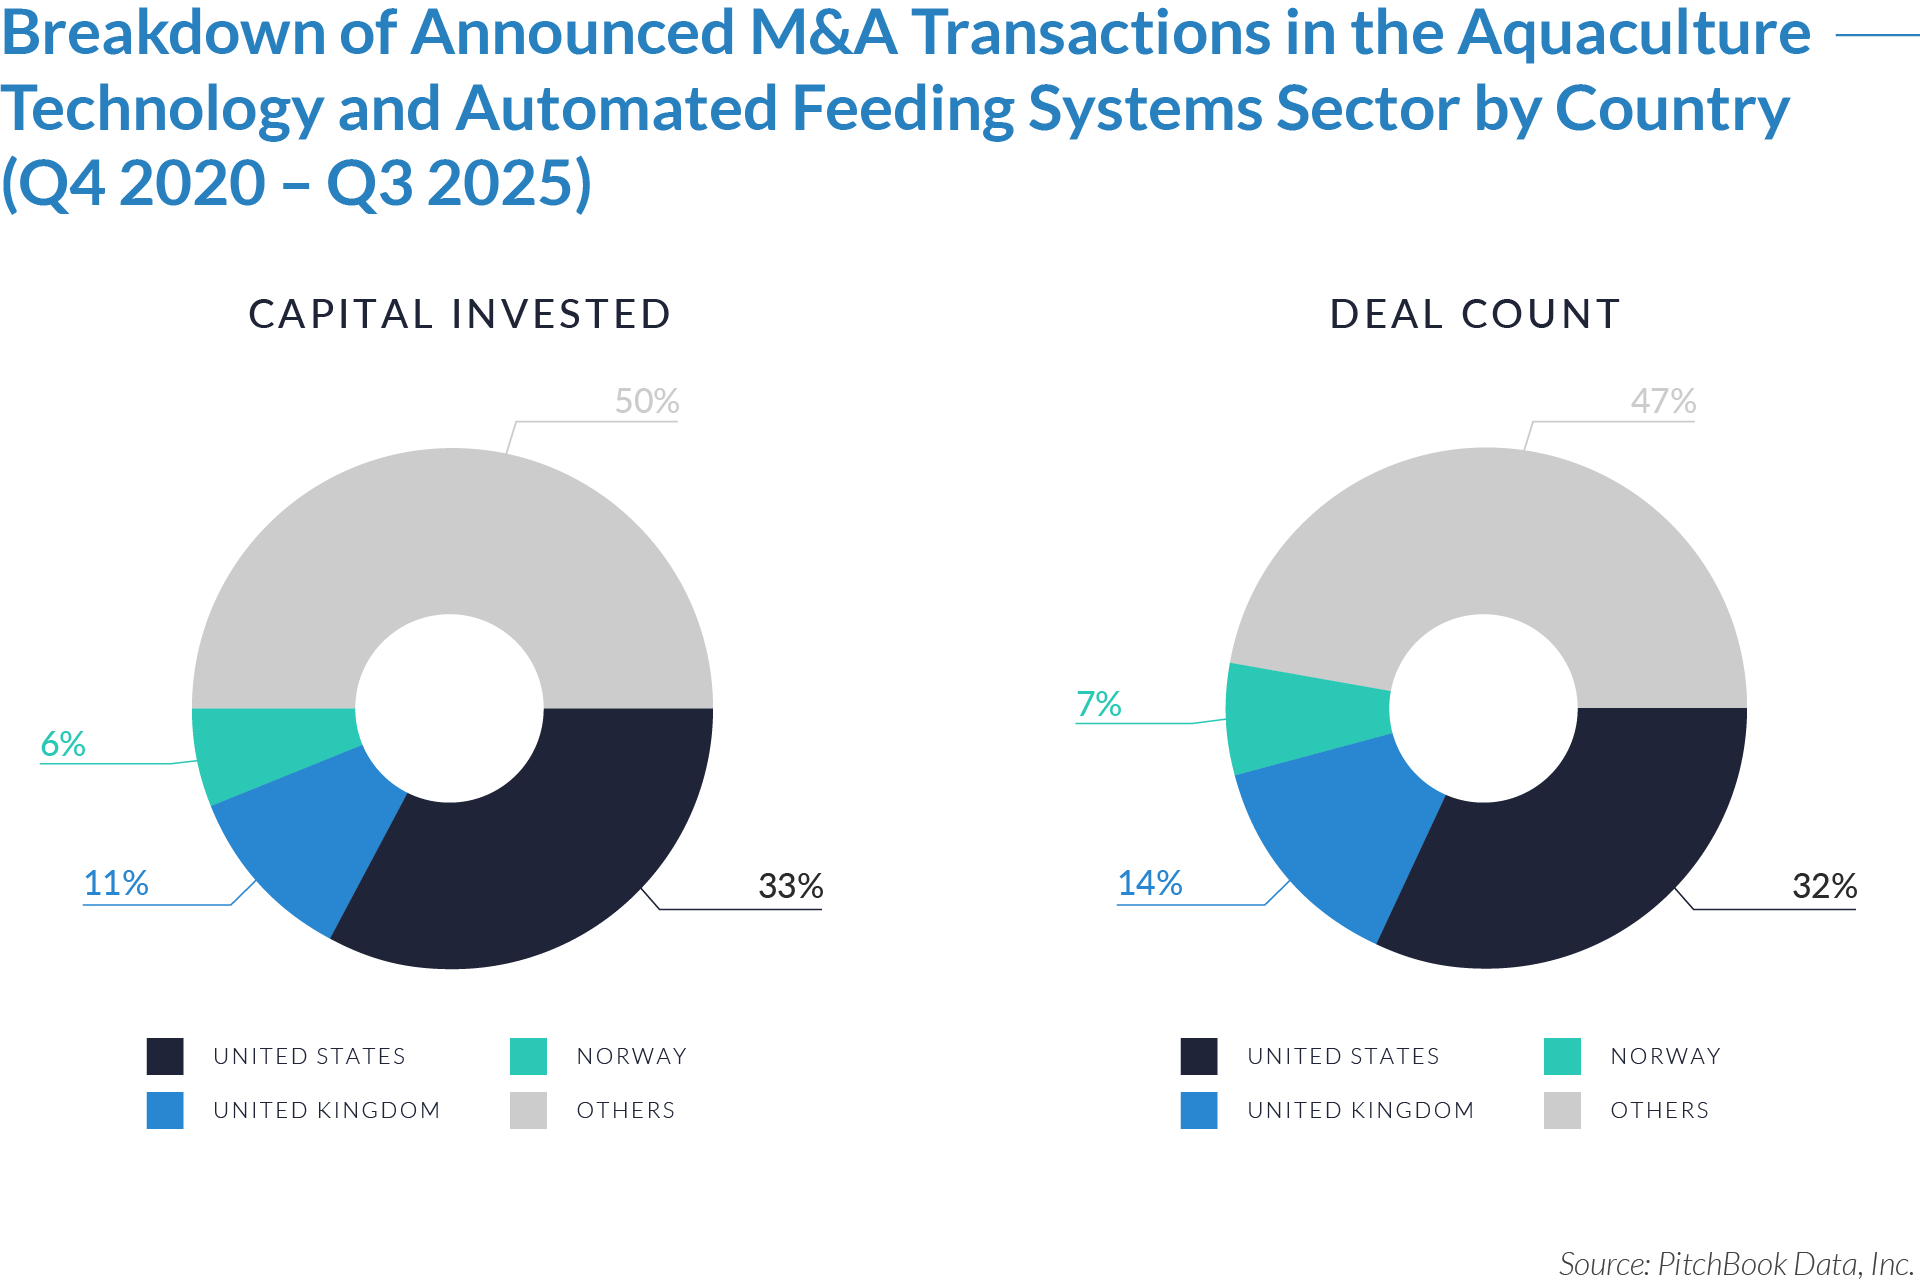
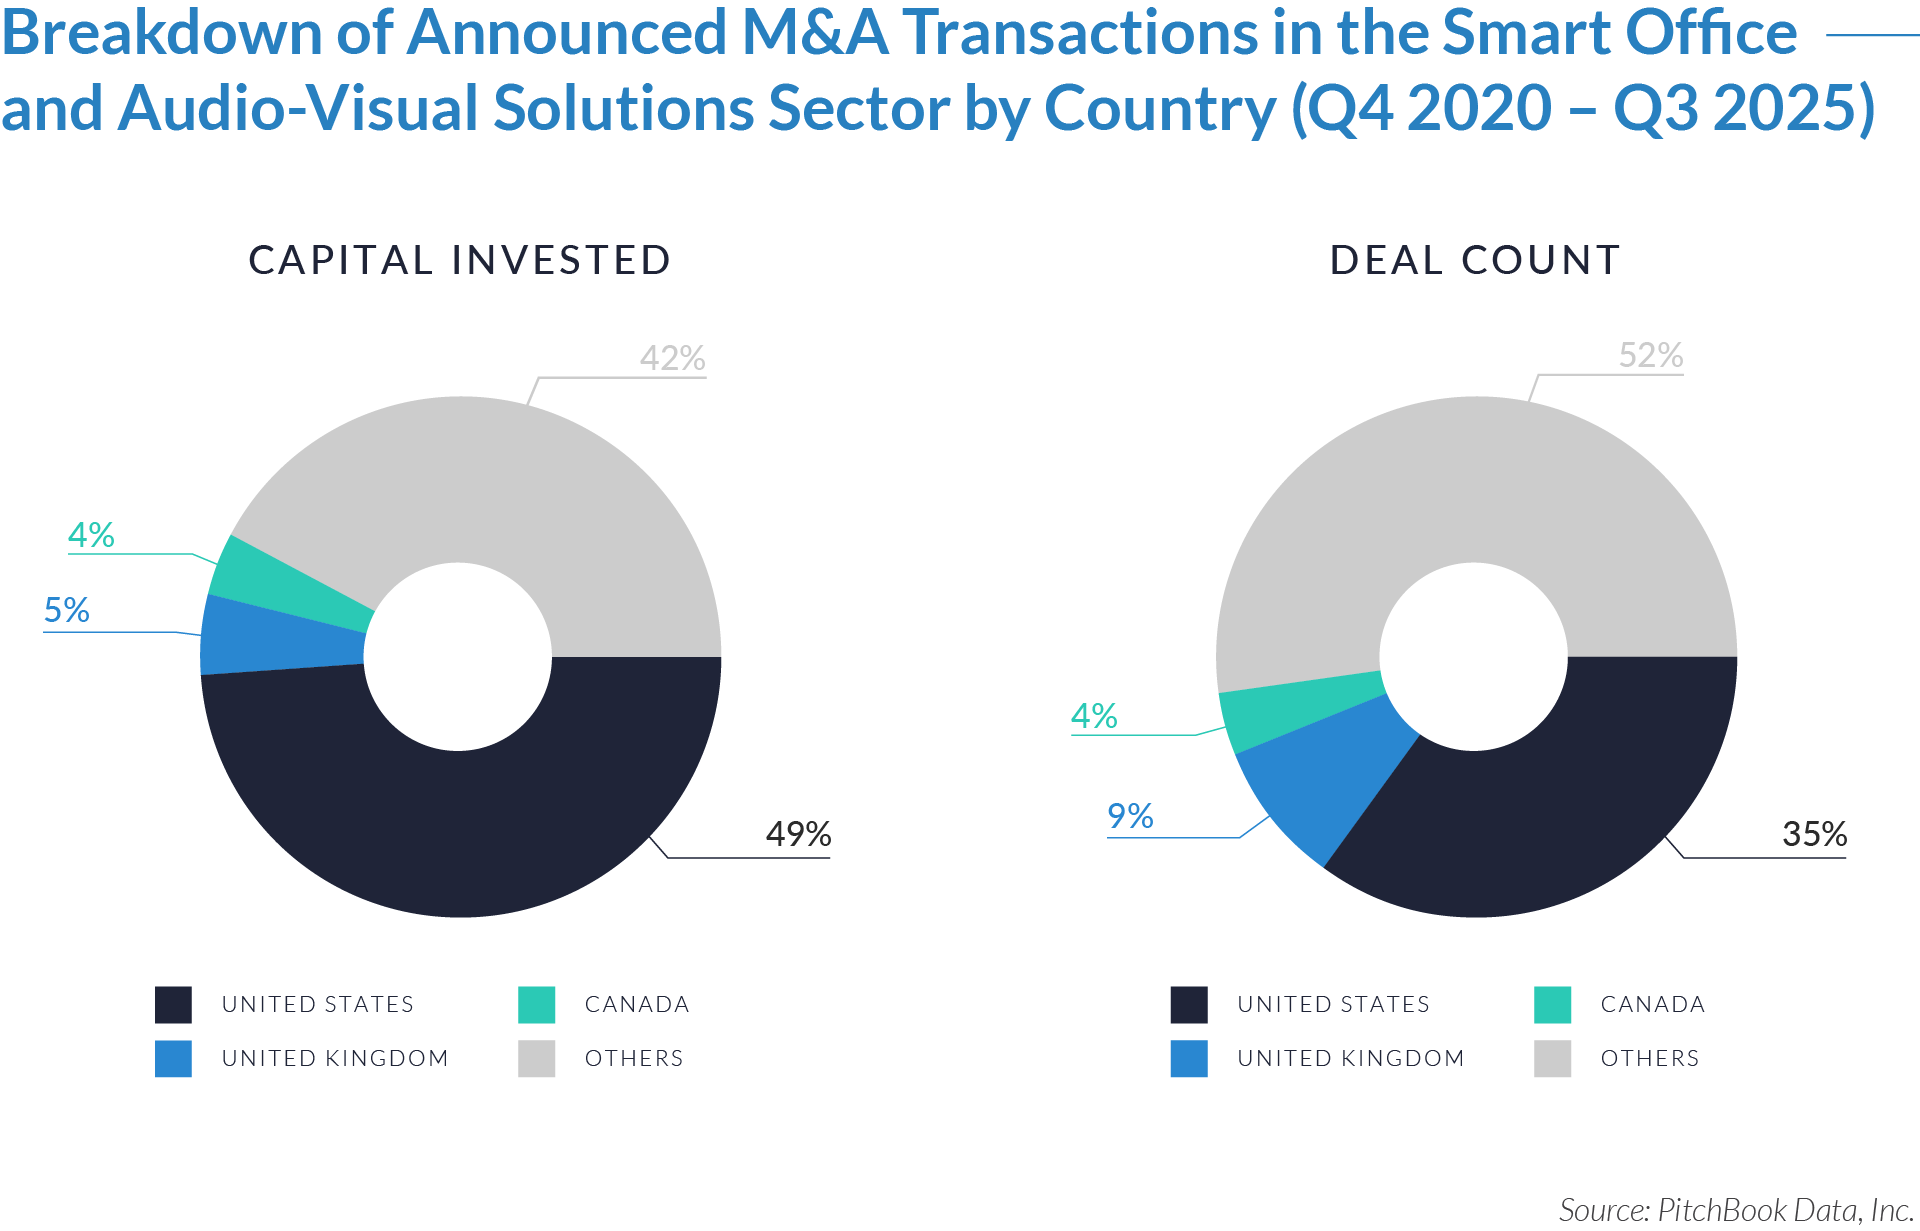
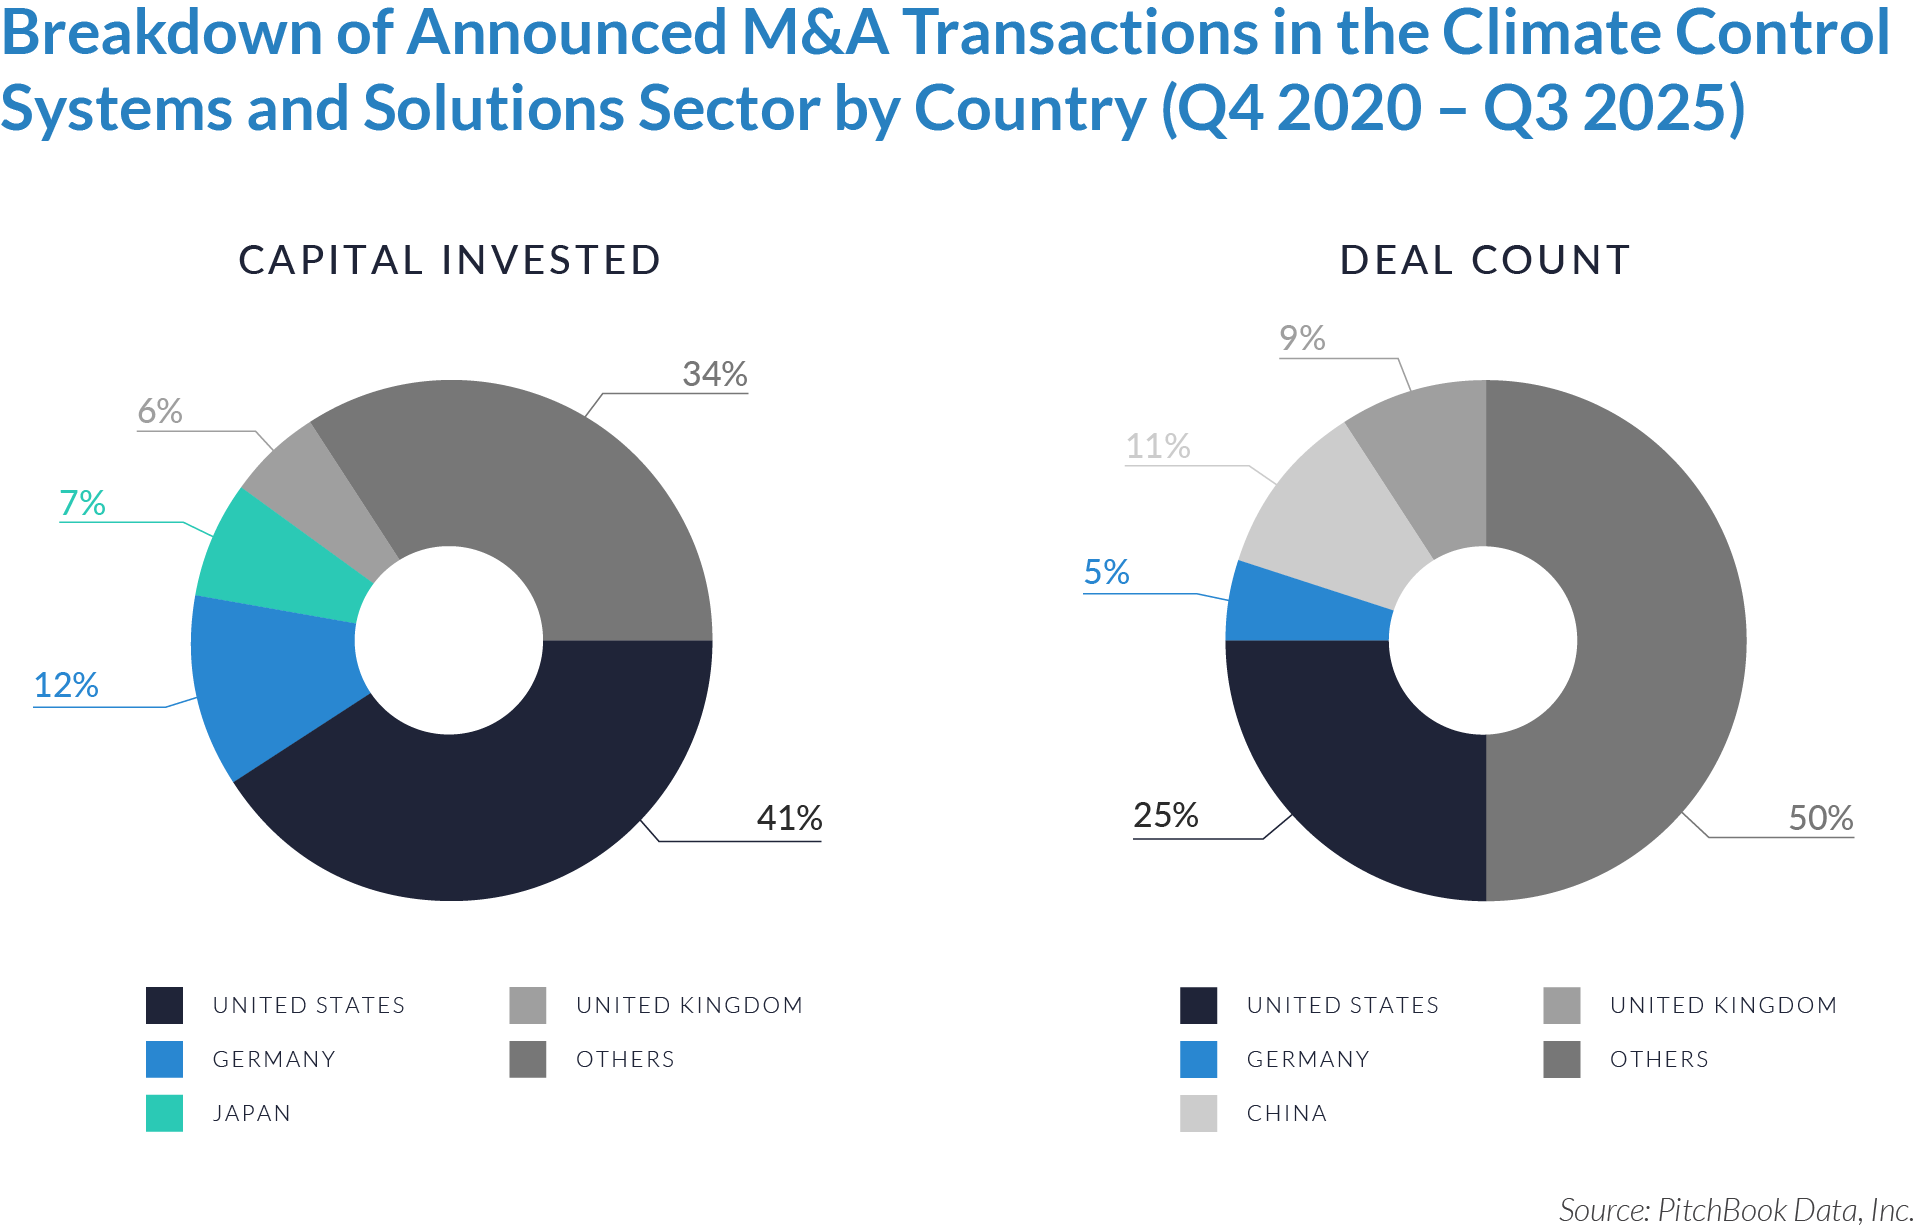
- The United States accounts for 57% of total capital invested while representing 37% of deal count, indicating that transactions involving US-based targets are significantly larger on average and serve as the primary locus for platform-scale acquisitions. This reflects the depth and maturity of the US market, where scaled workforce solutions platforms, strong client relationships, and exposure to long-duration energy and infrastructure project pipelines support larger transaction sizes. The US continues to represent a central hub for consolidation activity, attracting both domestic and cross-border investment.
- Japan and the United Kingdom reflect distinct but complementary investment dynamics, with Japan accounting for 12% of capital invested and 7% of deal count, and the UK representing 3% of capital and 12% of deal volume. Japan’s profile suggests a more concentrated market characterized by fewer, larger strategic transactions, while the UK exhibits a higher frequency of smaller transactions, consistent with a fragmented landscape where acquirers are pursuing regional consolidation, capability expansion, and incremental scale through mid-market and add-on acquisitions.
- Other international markets account for 44% of total deal volume and 28% of capital invested, highlighting a broad and highly fragmented global landscape outside core markets. This distribution indicates that M&A activity in these regions is predominantly driven by smaller, localized transactions, including tuck-in acquisitions and niche capability expansion, rather than large-scale platform deals. The disparity between deal volume and capital invested implies lower average transaction sizes and reflects regional fragmentation, smaller operator scale, and varying levels of capital availability, while also indicating a significant runway for future consolidation as platforms scale.
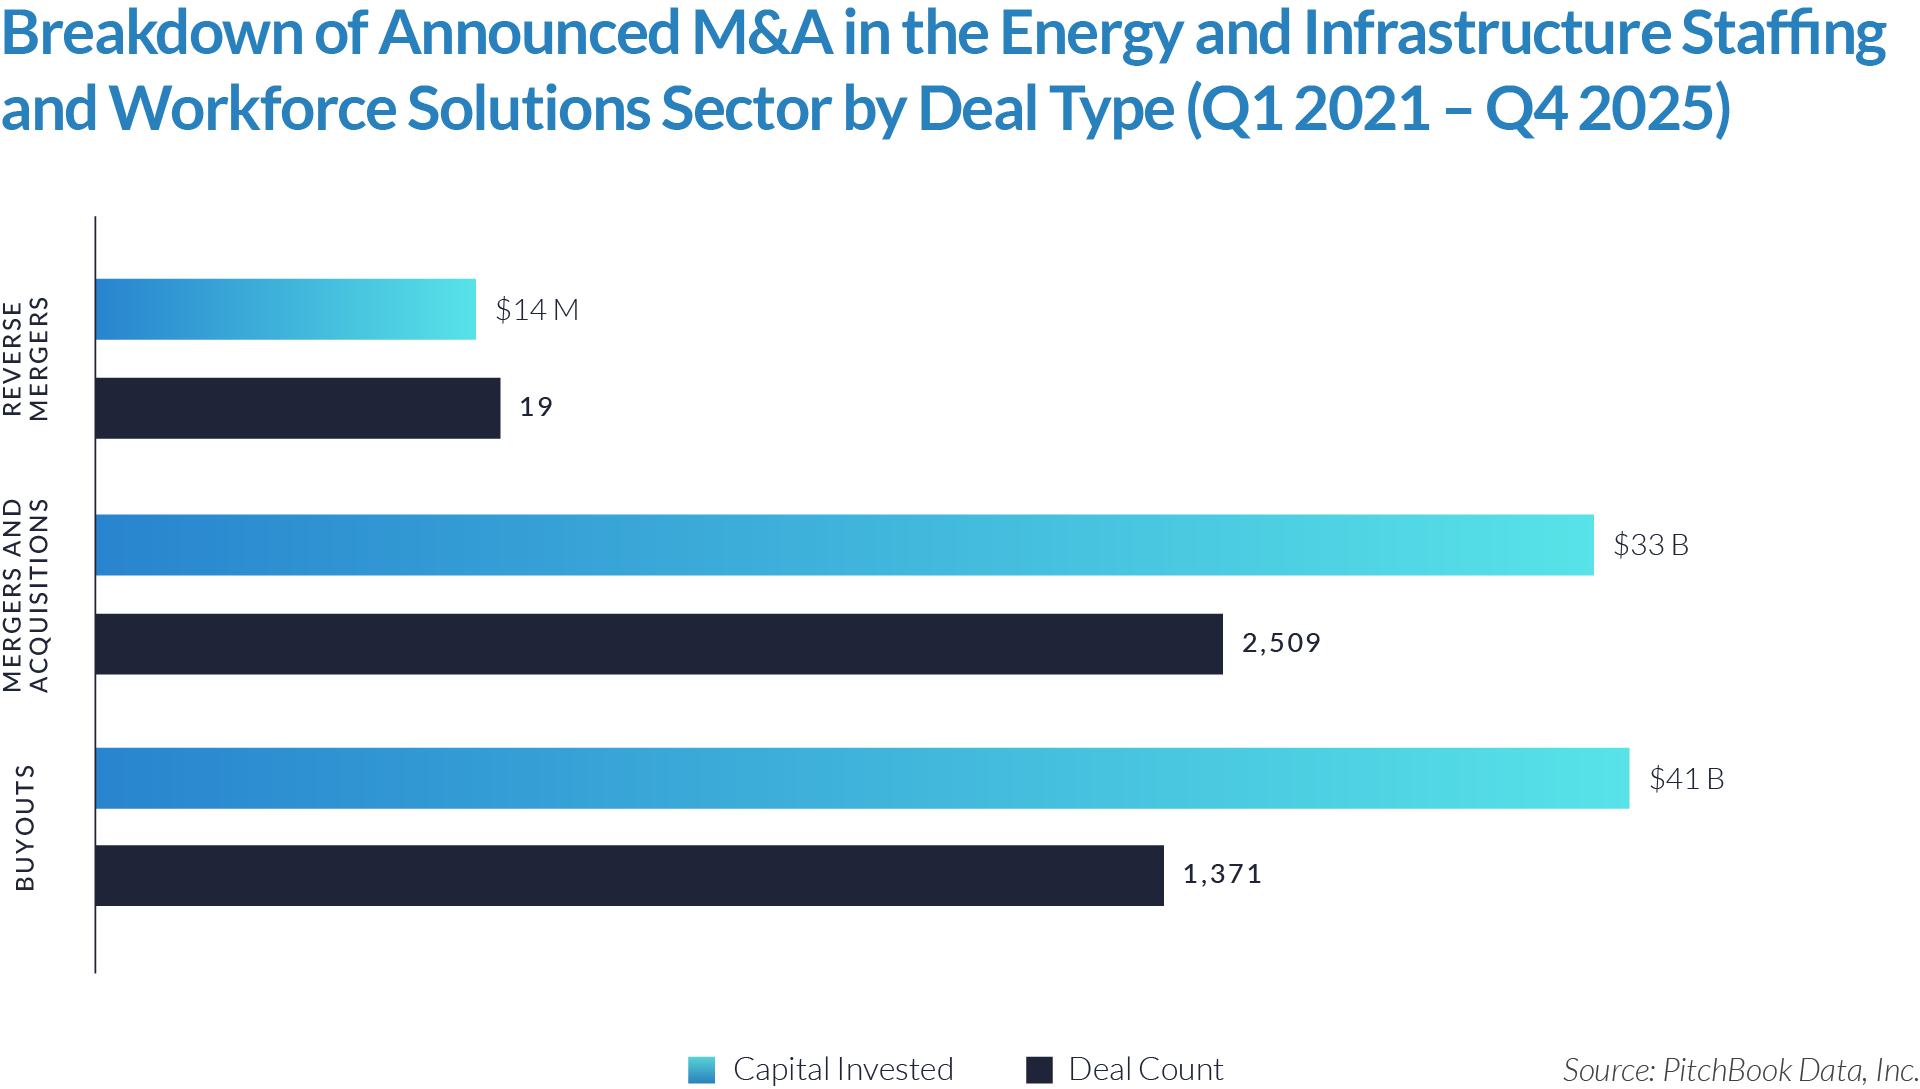
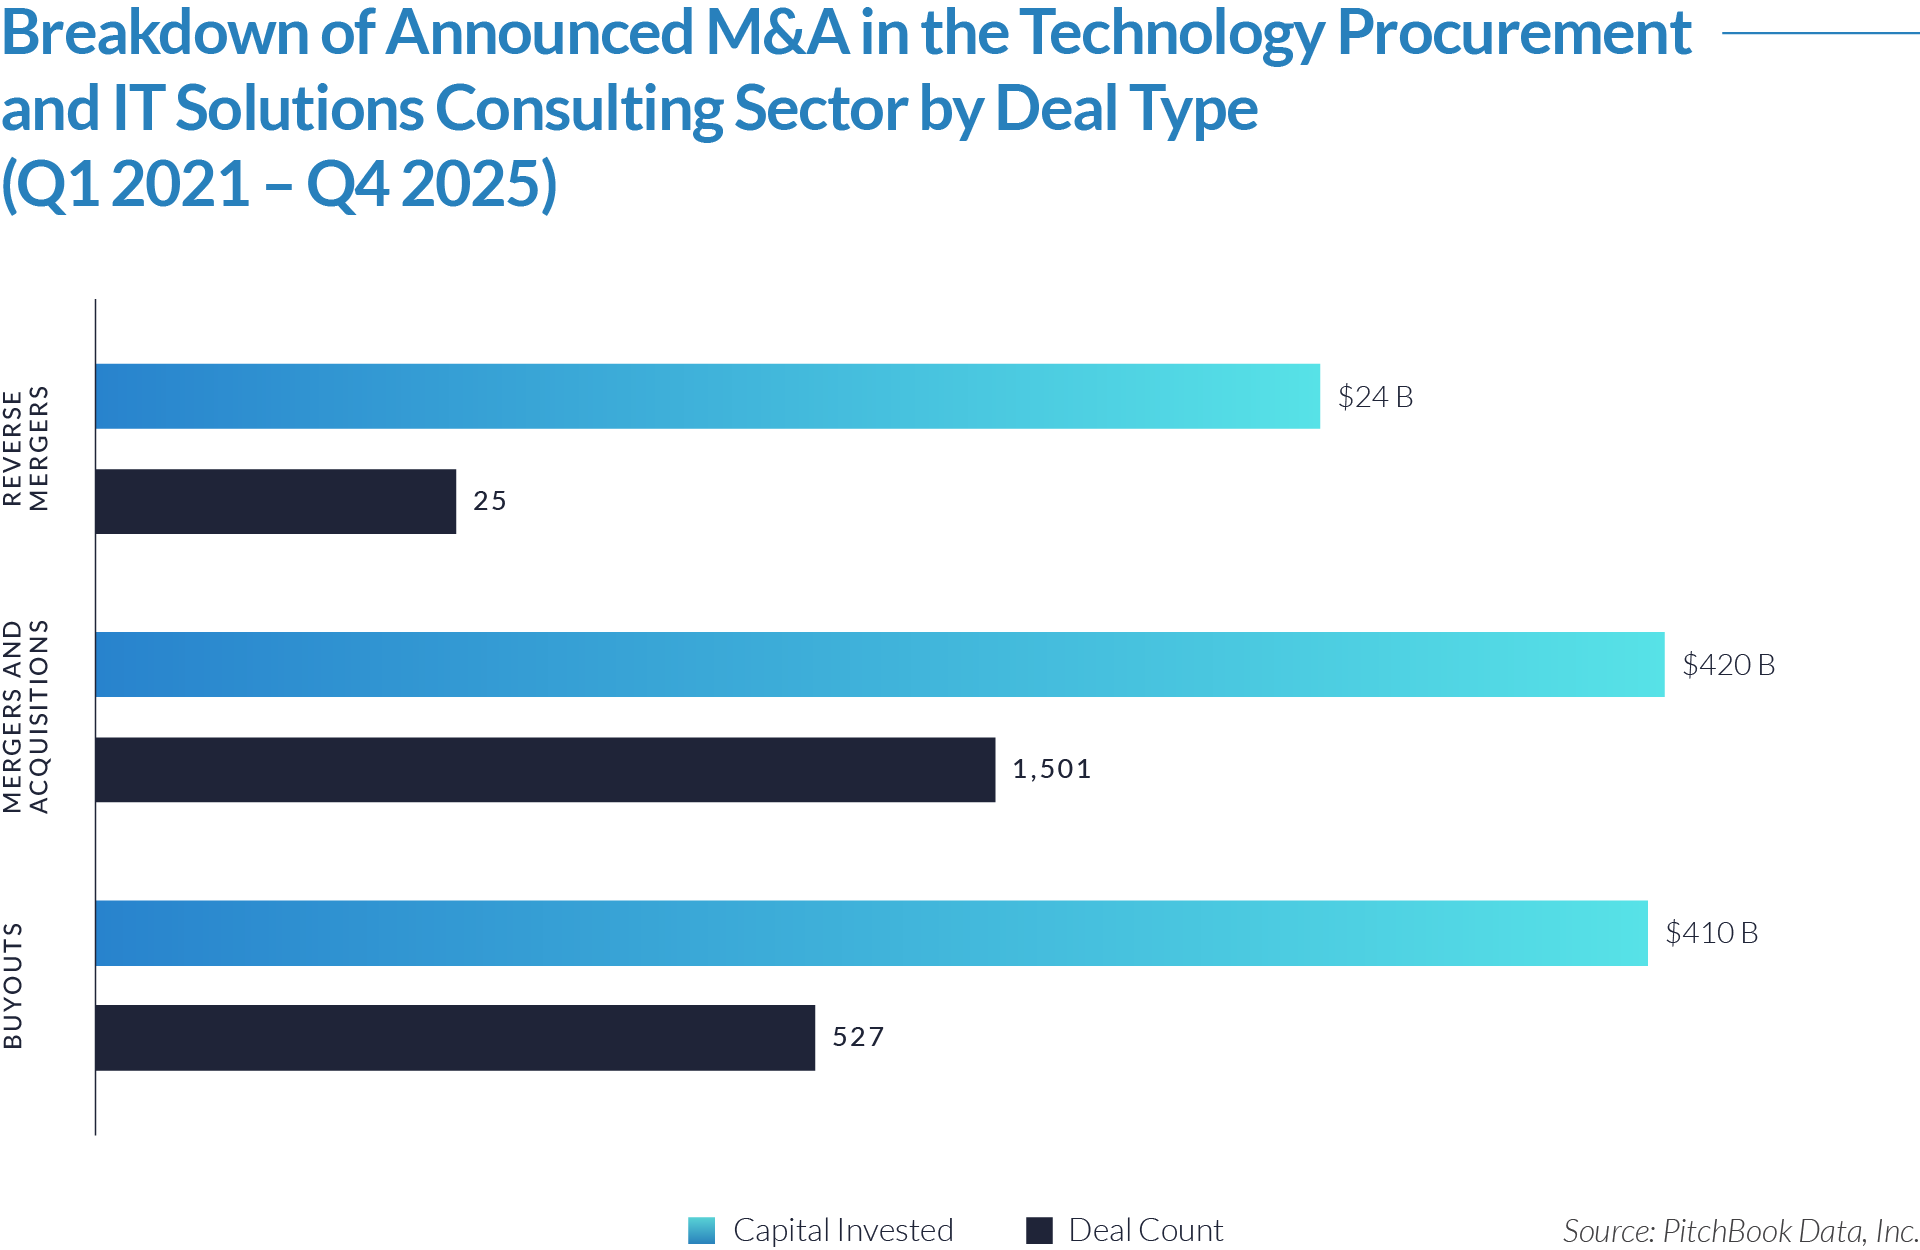
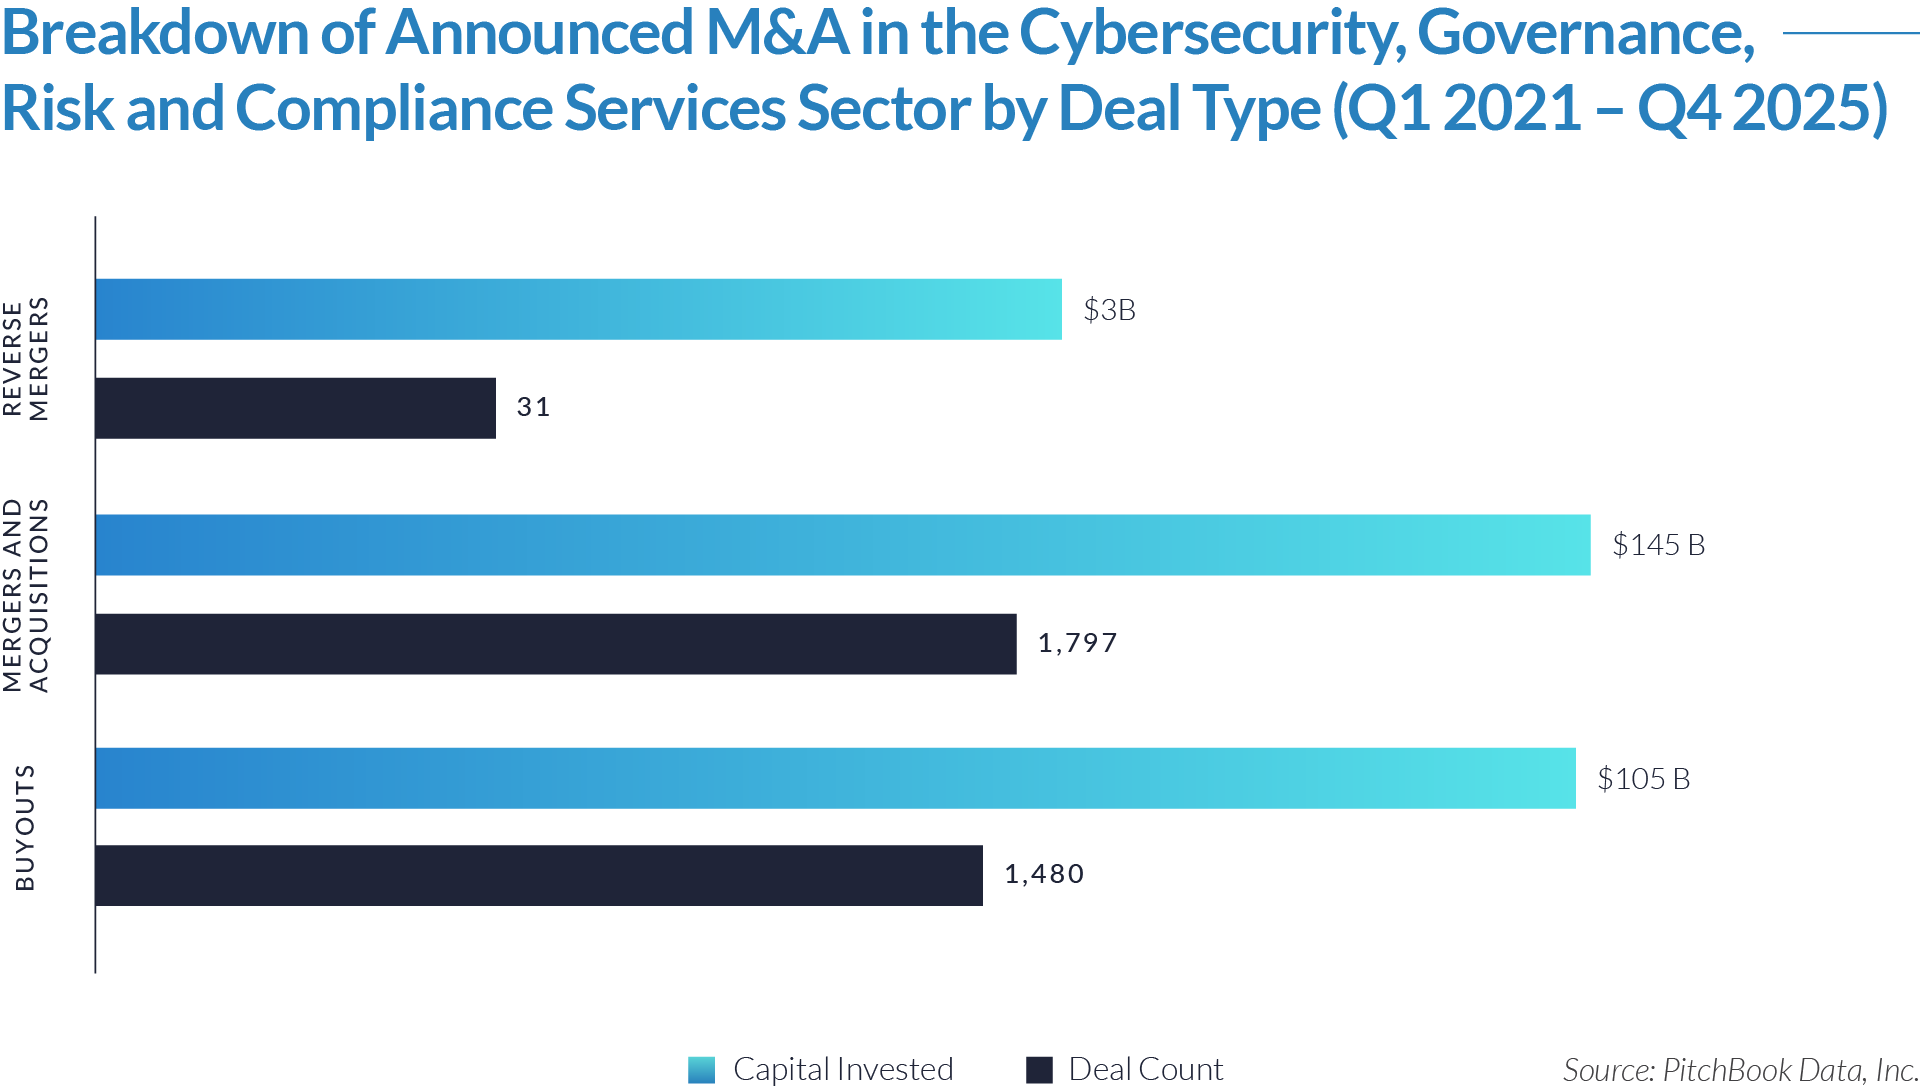
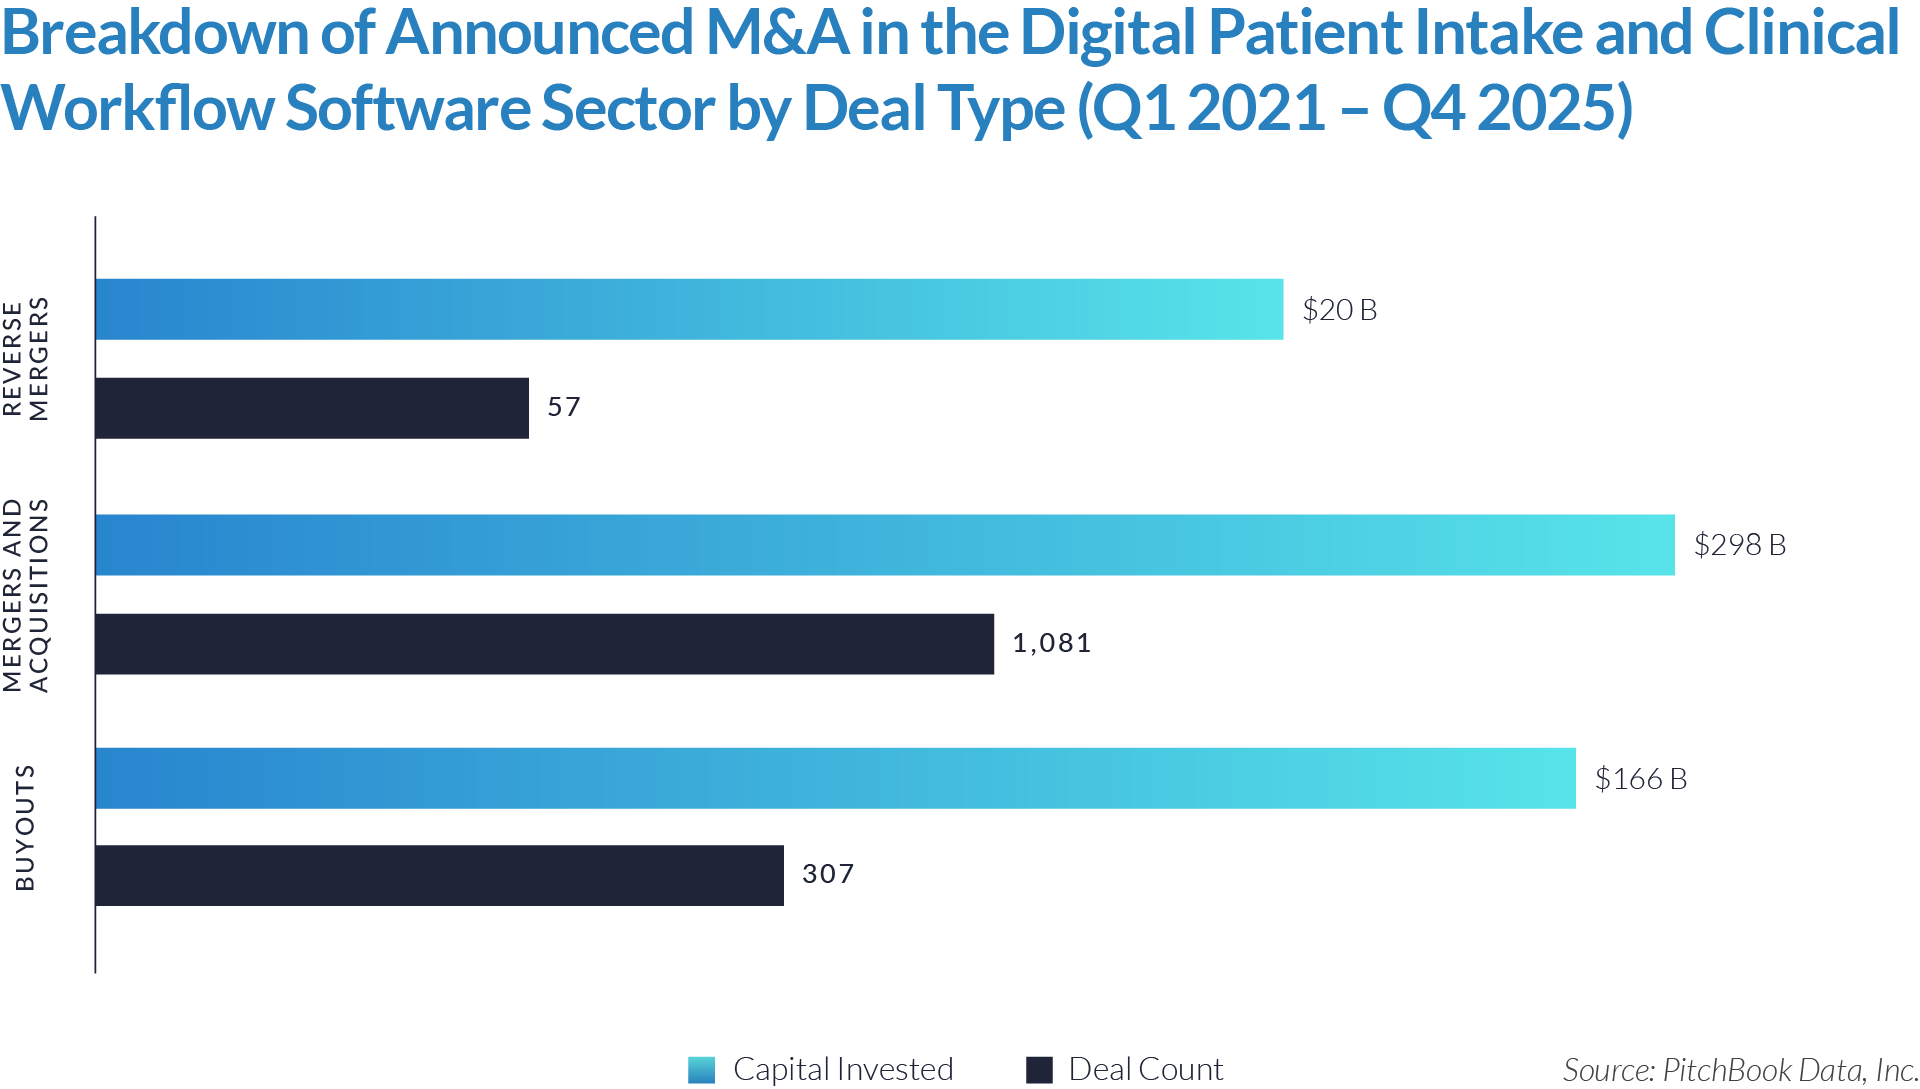
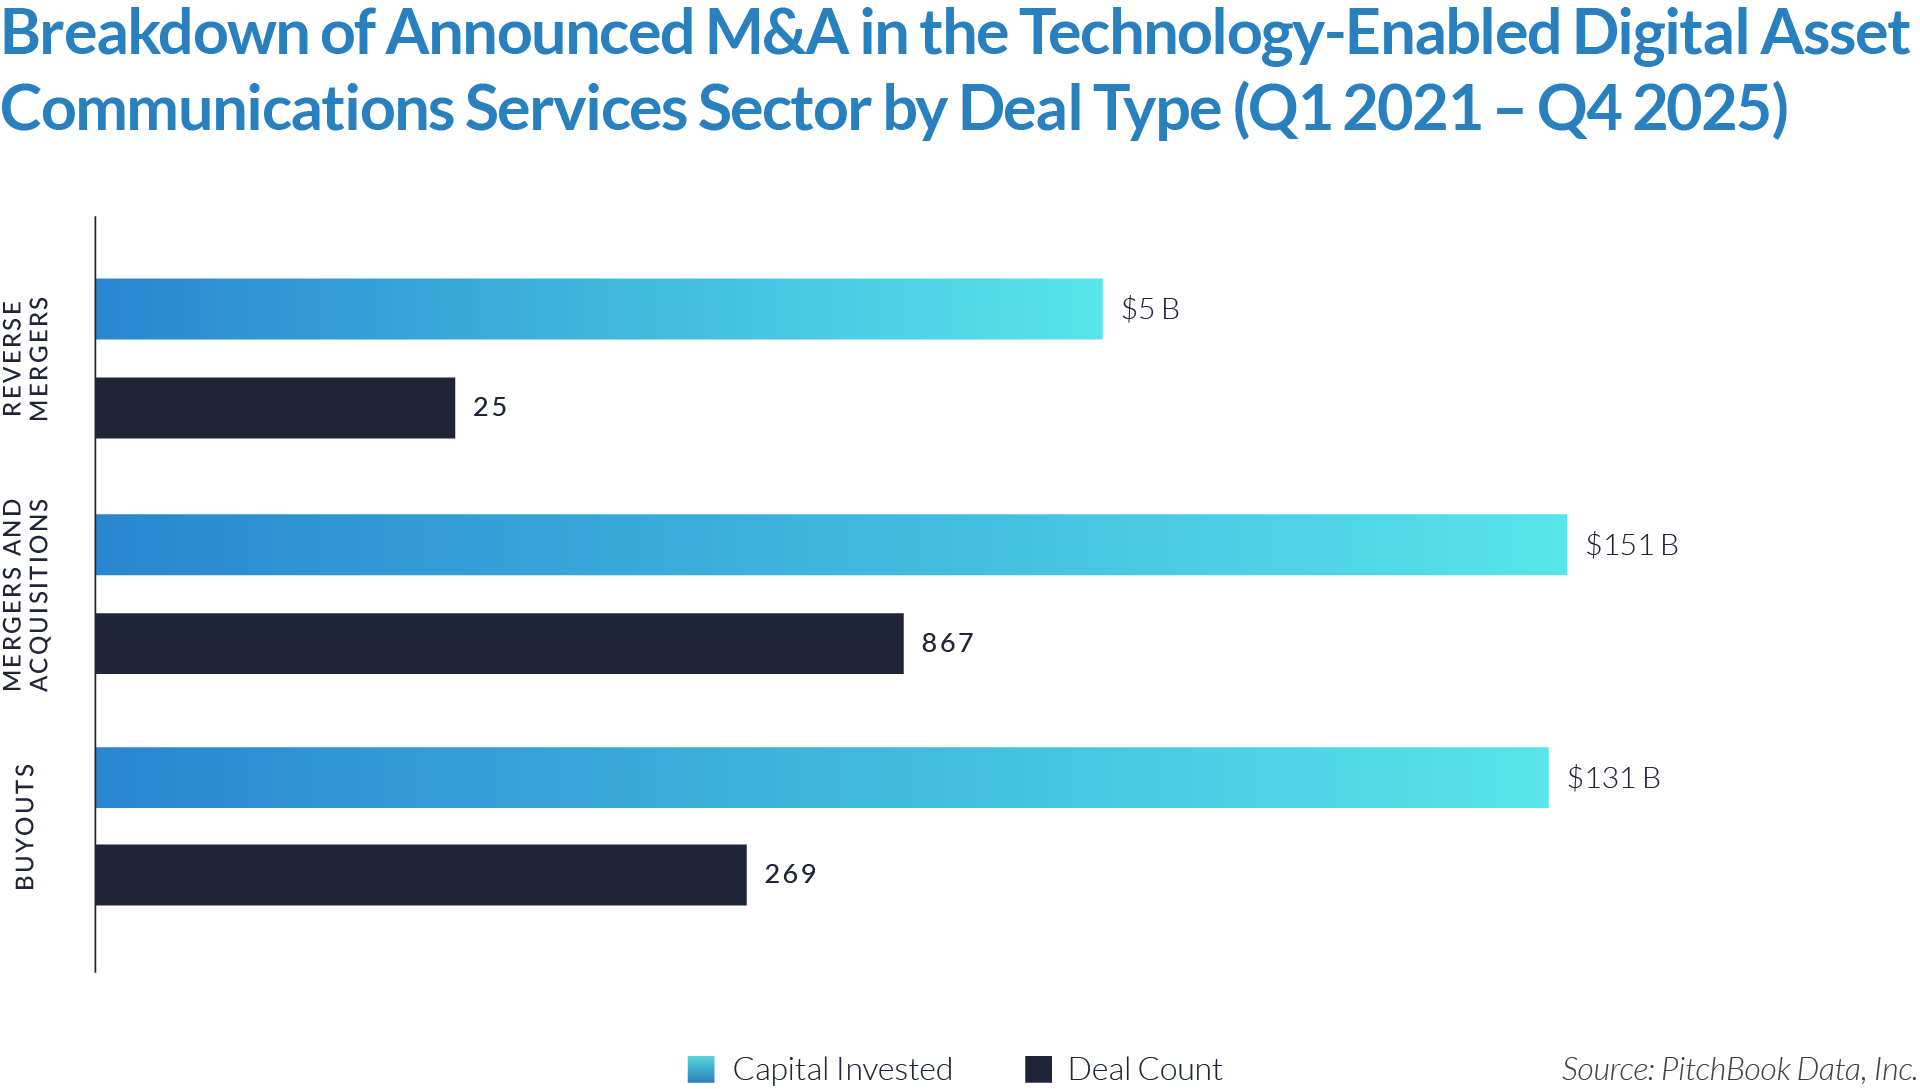
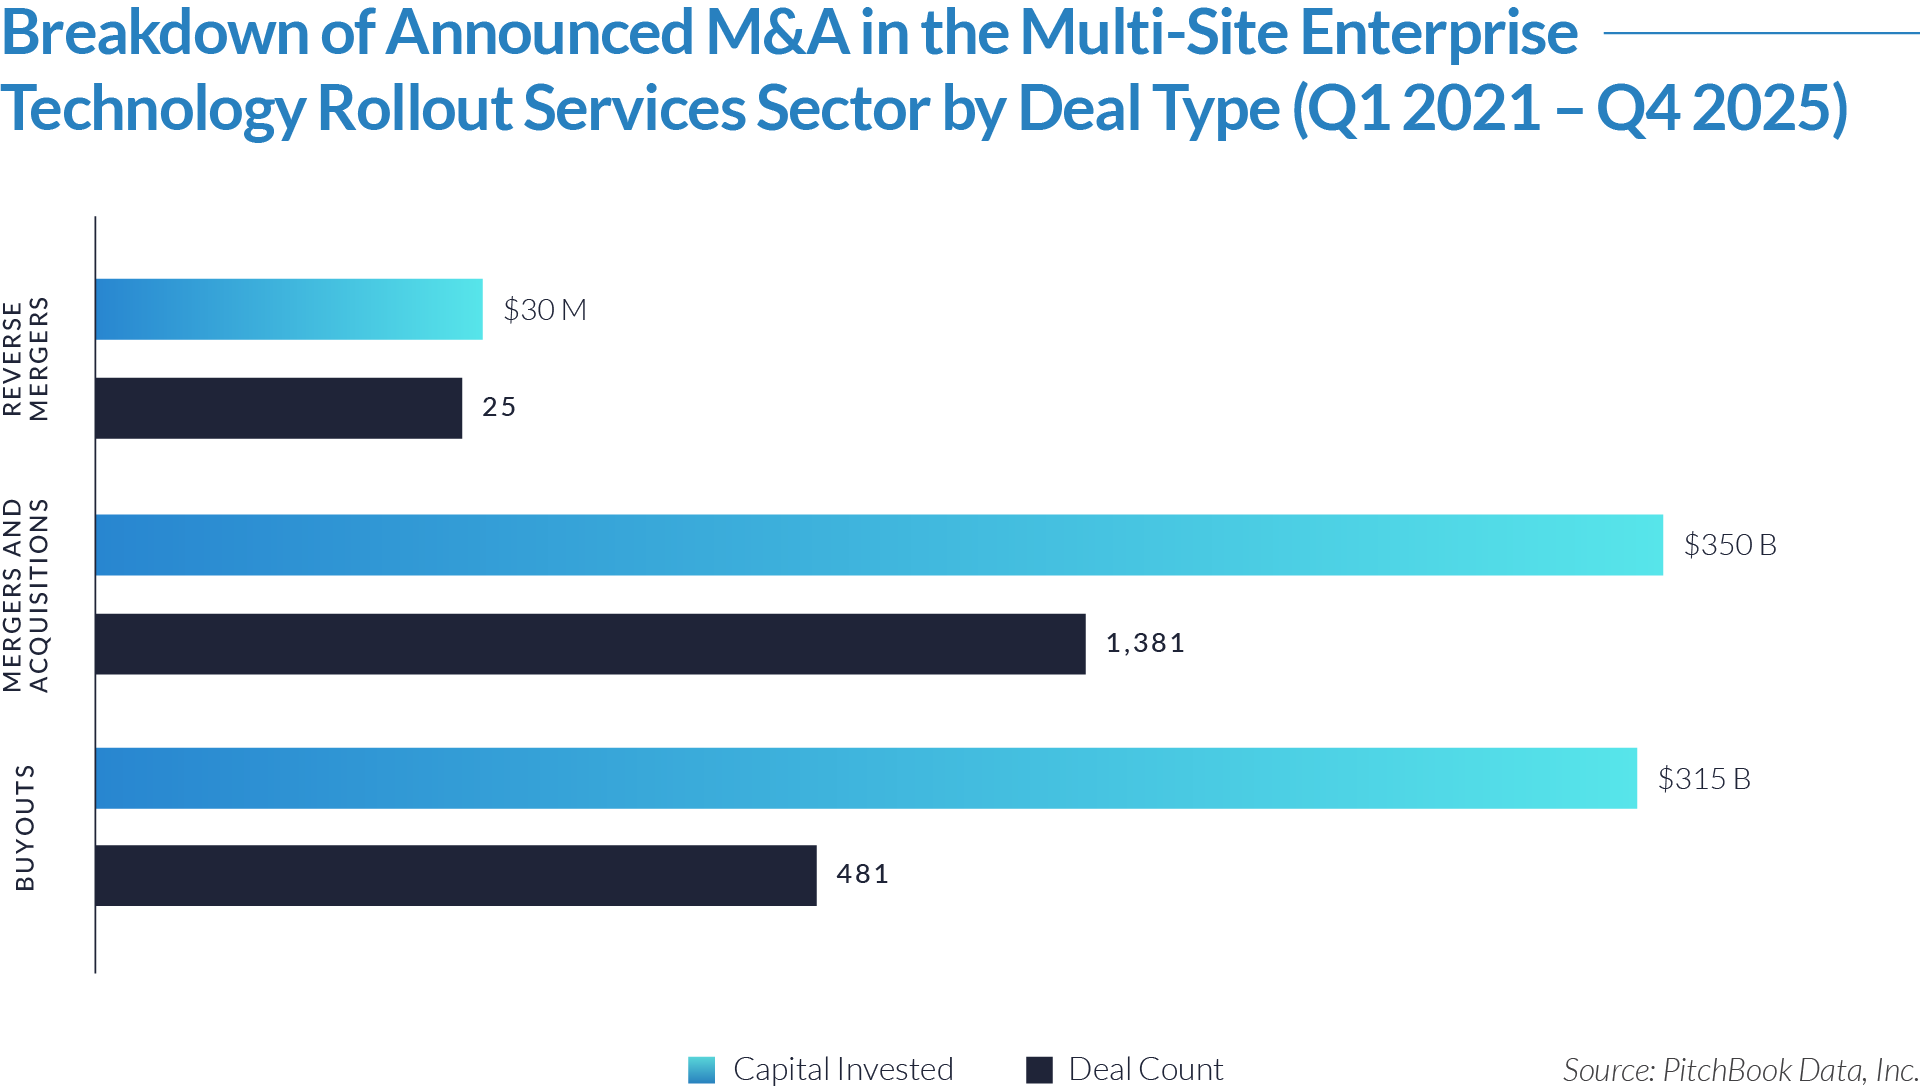
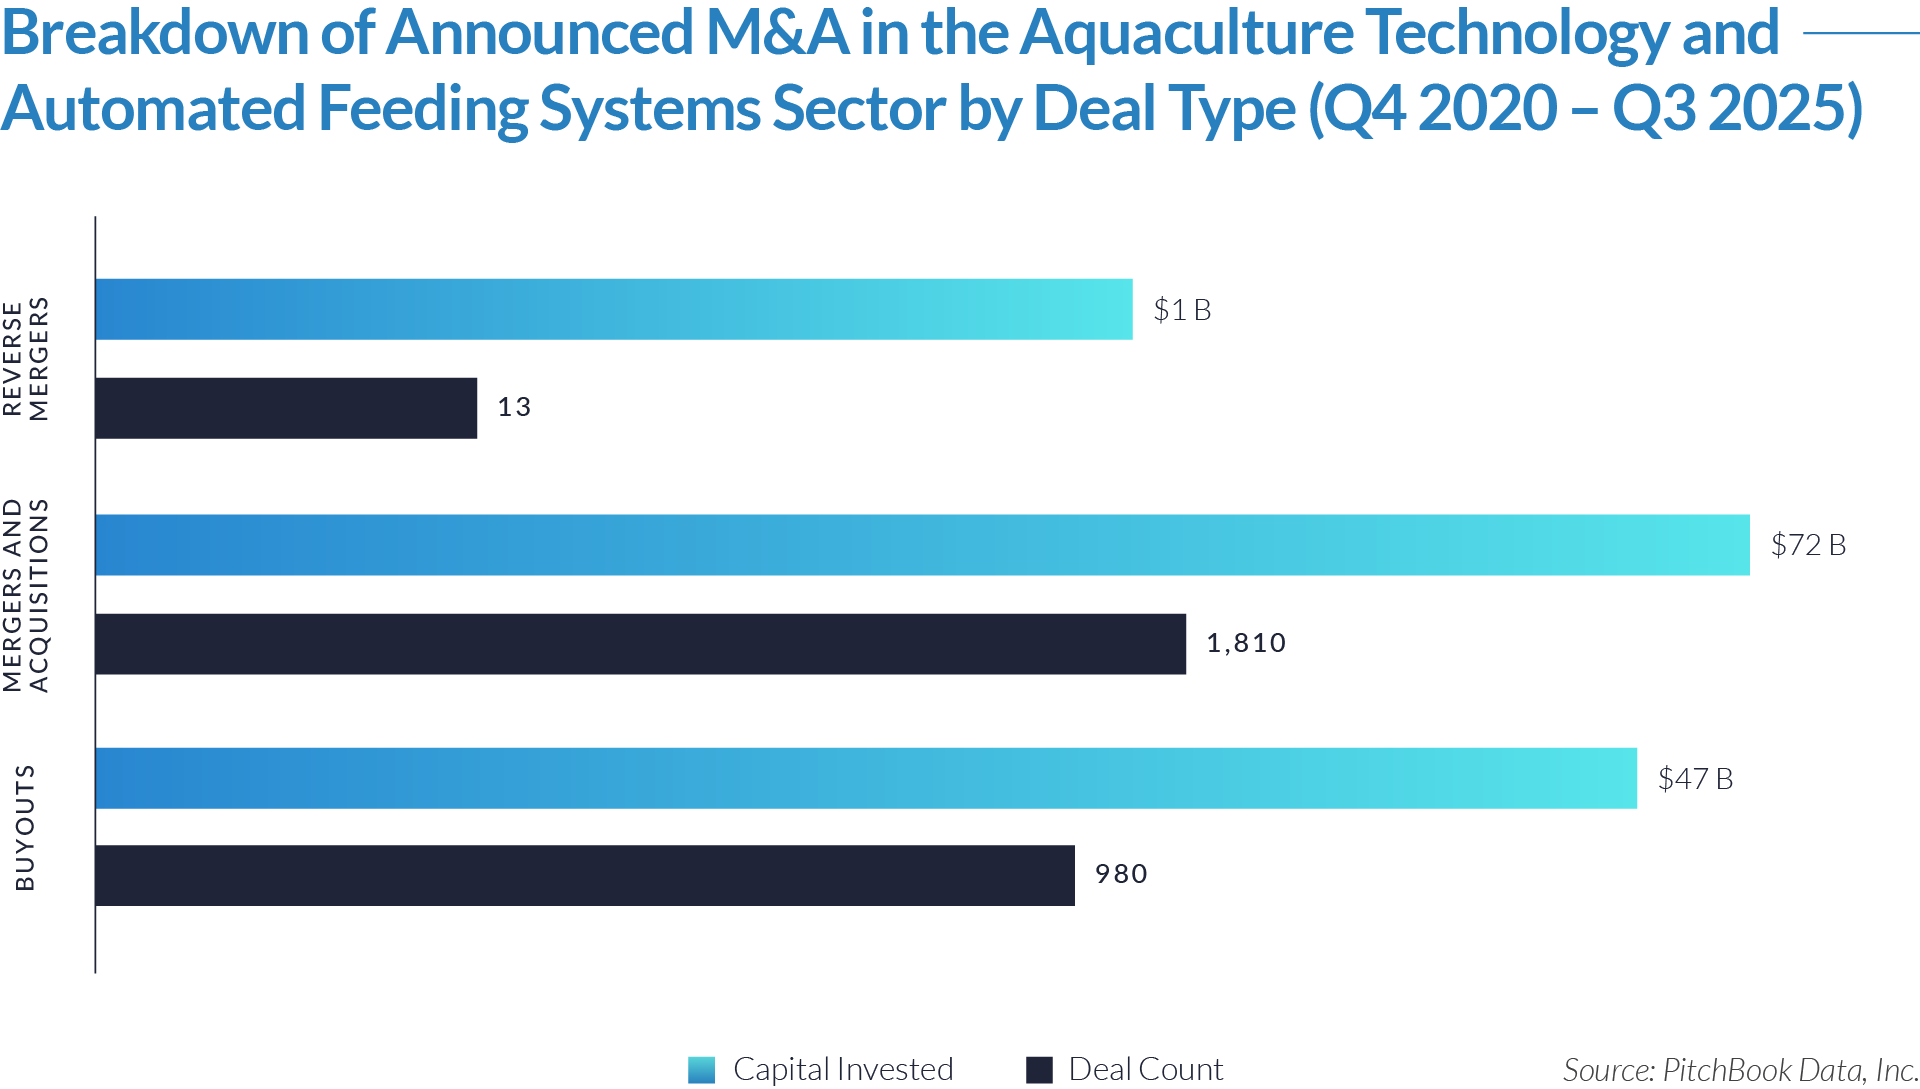
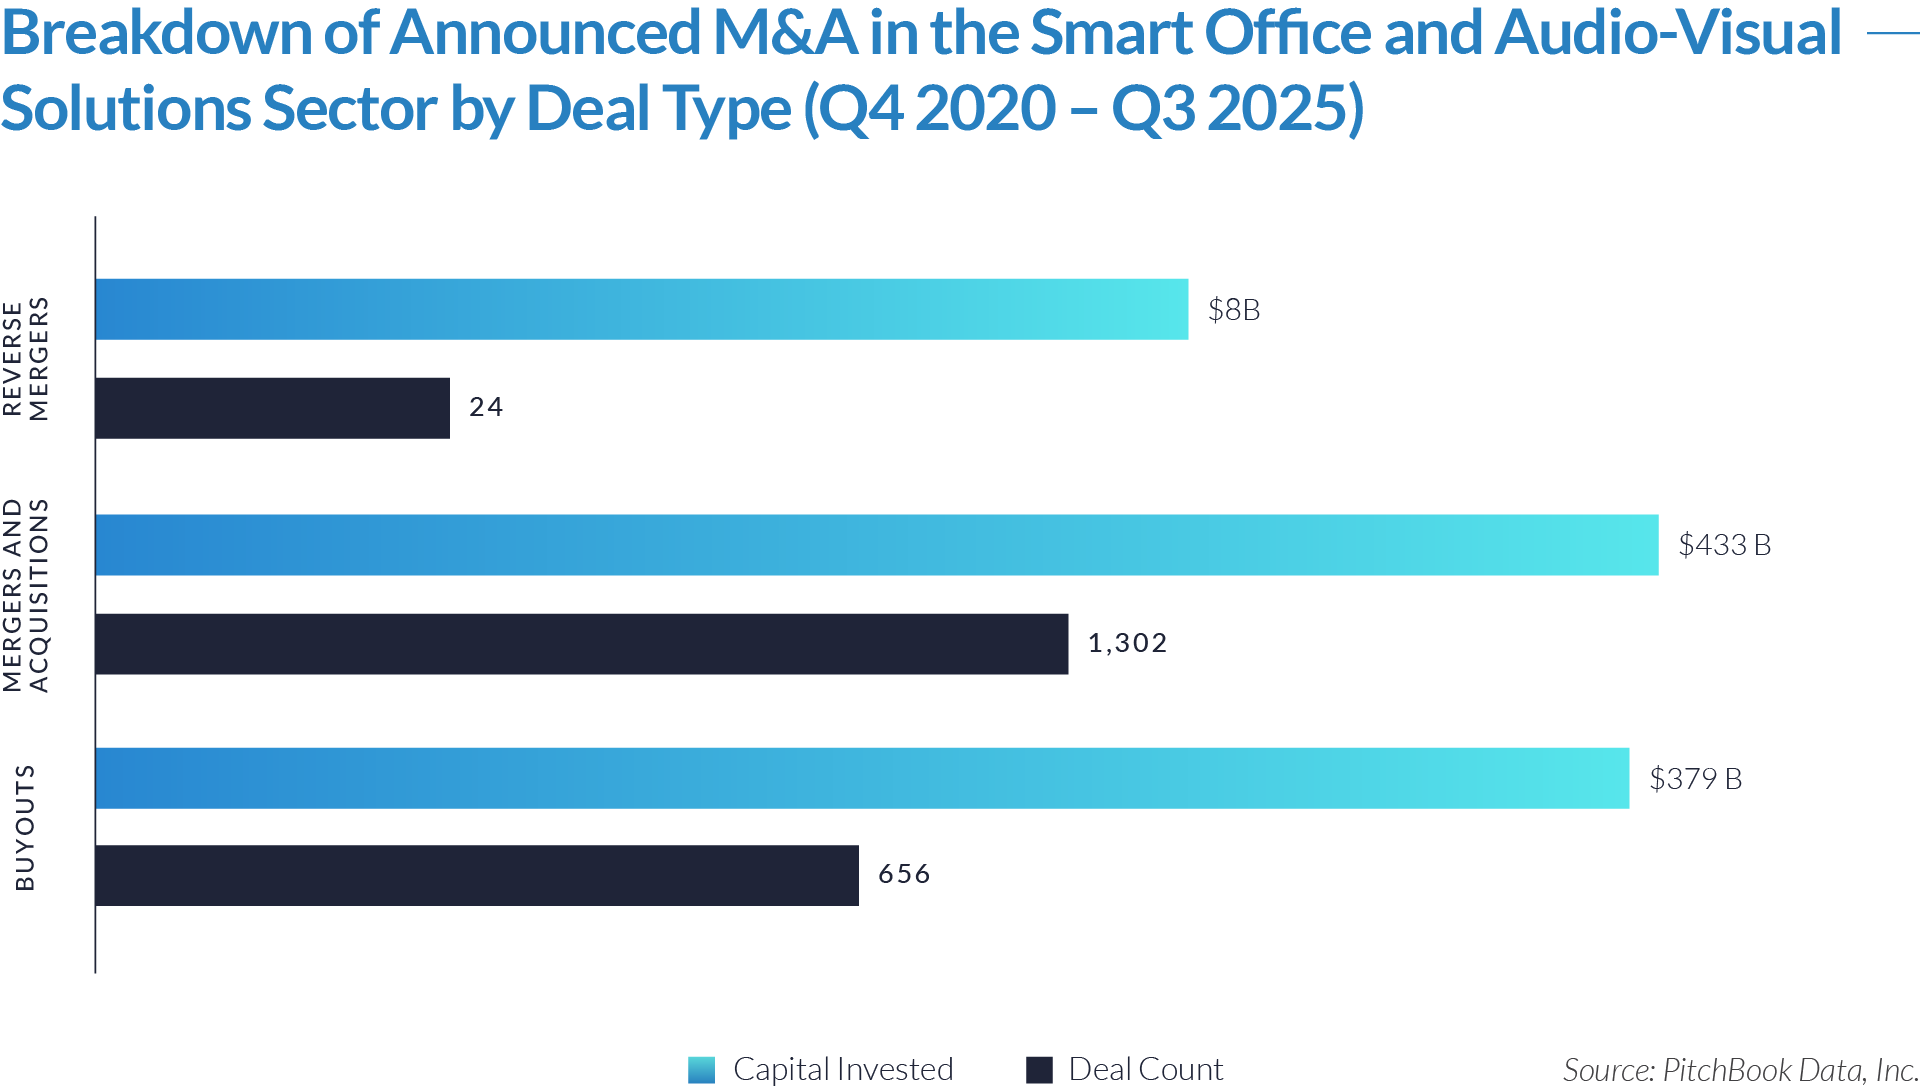
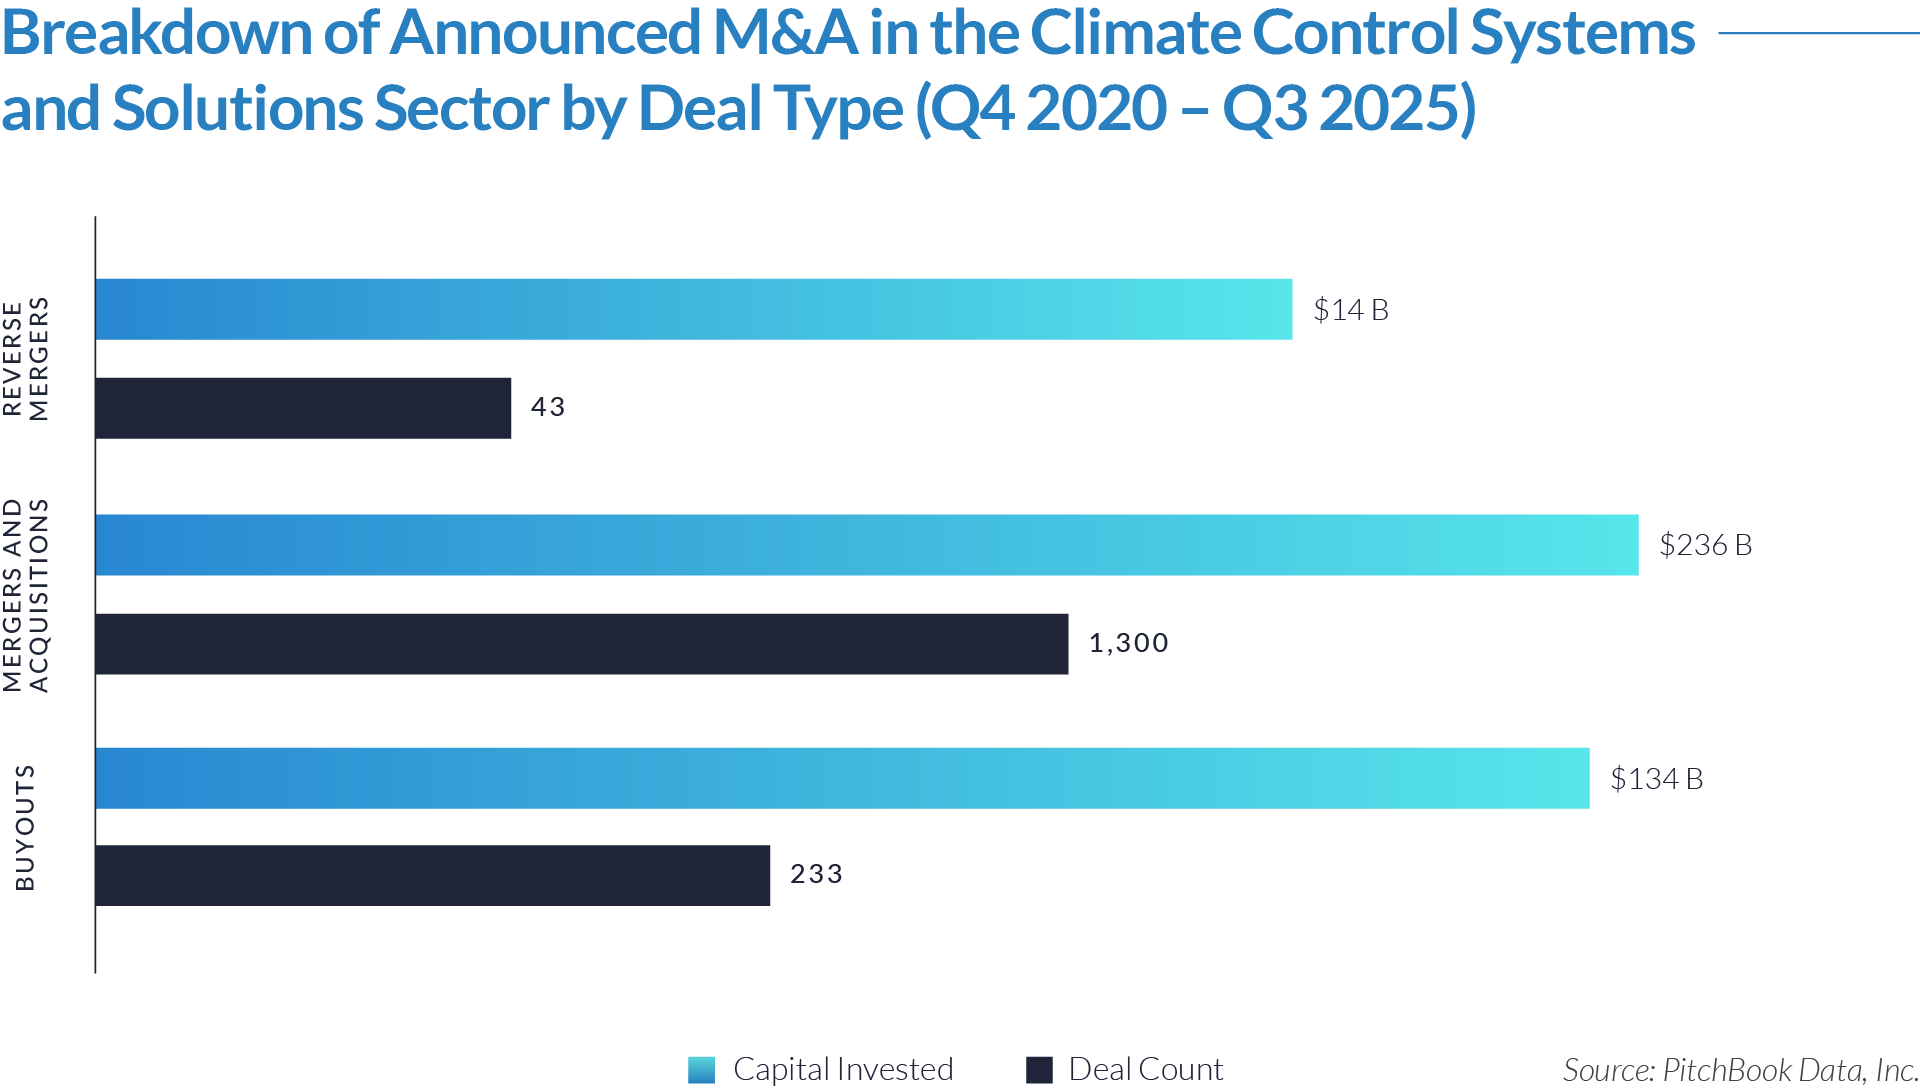
- Mergers and acquisitions accounted for most transaction activity, totaling 2,509 deals, but represented approximately $33 billion of invested capital. This reflects a high volume of smaller, strategic and add-on acquisitions across a fragmented provider landscape, as acquirers pursue geographic expansion, client diversification, and incremental capability build-out within energy and infrastructure staffing markets.
- Buyouts represented the dominant source of capital deployment, accounting for approximately $41 billion across 1,371 transactions, despite lower deal volume relative to M&A. This imbalance highlights significantly larger average transaction sizes and reflects sustained private equity focus on platform formation, where sponsors target scaled workforce solutions providers with recurring contractor demand and opportunities for margin expansion through operational efficiencies and add-on acquisitions.
- Reverse mergers remained immaterial, totaling just 19 transactions and approximately $14 million of invested capital, indicating that public market entry strategies are largely limited in this sector. M&A activity is instead driven by private market consolidation, where valuation and strategic interest are primarily tied to operational scale, client relationships, and the ability to support long-duration energy and infrastructure project pipelines.
M&A Transactions Case Studies
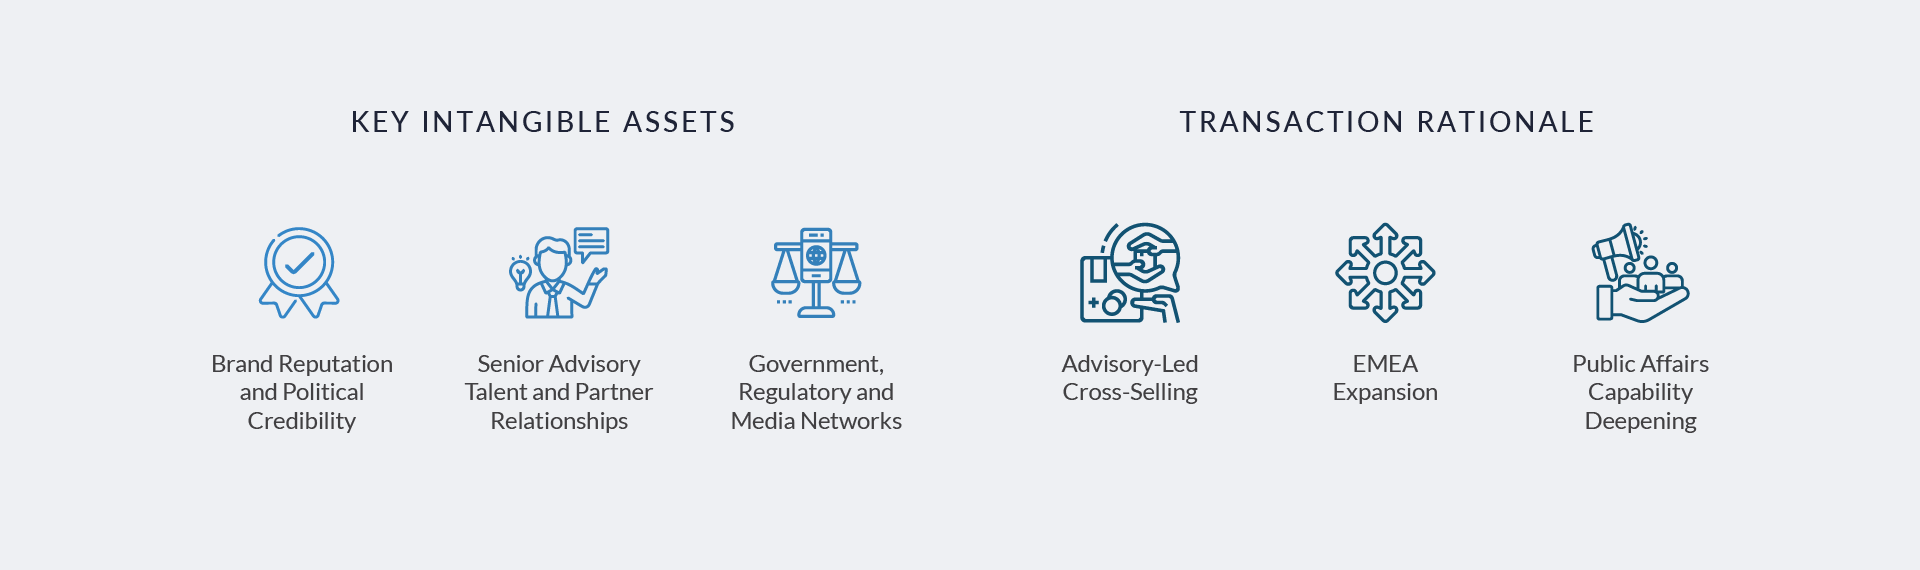
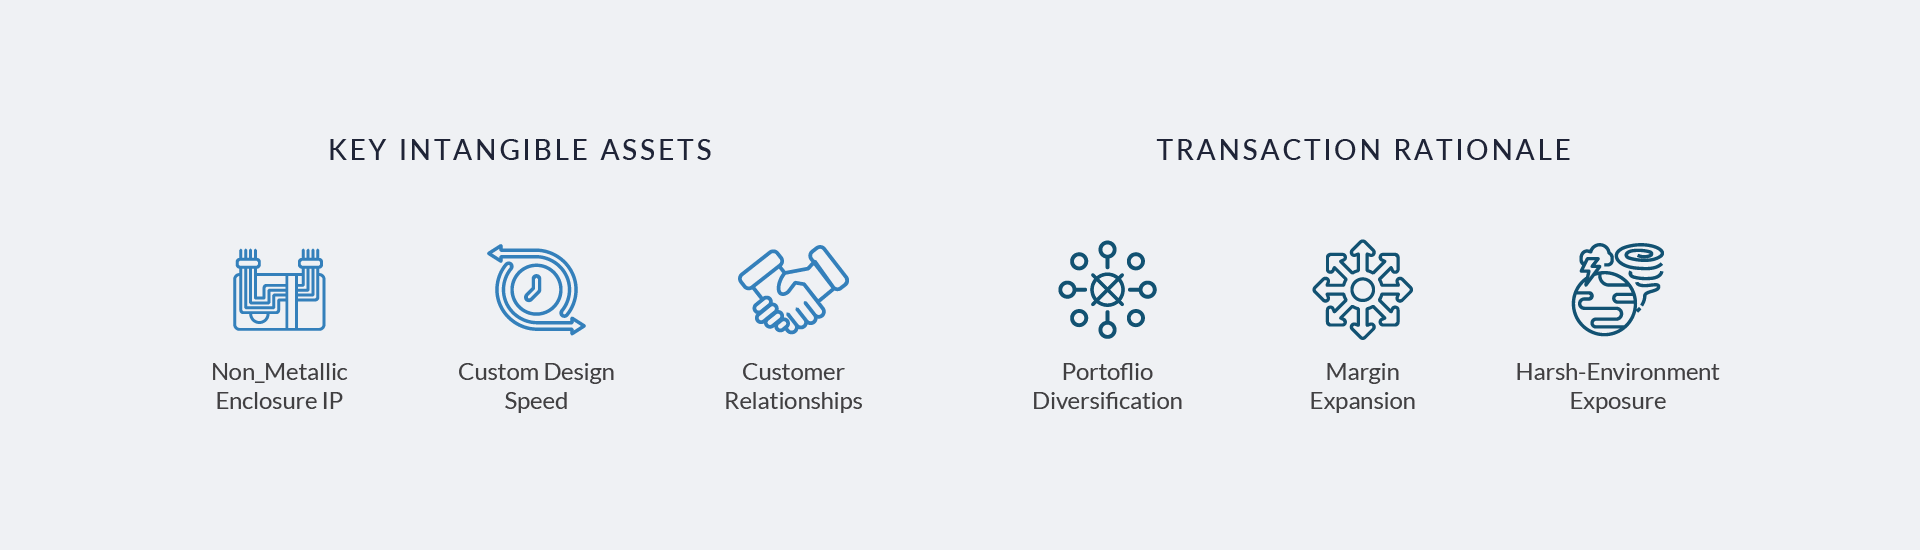
Three transactions in the sector highlight increasing private equity and strategic focus on scaled workforce solutions platforms that support technically complex, project-driven end markets. Acquirers are prioritizing businesses with established talent networks, cross-border delivery capabilities, and deep exposure to engineering, technical, and skilled trades labor across energy, renewables, and infrastructure sectors. These platforms are positioned as critical enablers of project execution, benefiting from recurring contractor demand, long-term client relationships, and structural labor shortages, supporting durable revenue visibility and sustained consolidation across a fragmented global market.

Case Study 01
SHIPYARD STAFFING
Shipyard Staffing is a US-based provider of skilled trades and industrial staffing solutions, specializing in the recruitment and placement of craft labor across shipbuilding, marine, manufacturing, and broader industrial sectors. The company supplies temporary, contract, and project-based workers to labor-intensive environments, supporting maintenance, repair, and new-build projects. Shipyard Staffing focuses on sourcing experienced tradespeople, including welders, electricians, and pipefitters, and operates through a regional delivery model focused on high-demand industrial and coastal markets.

Acquirer
NSC Technologies is a US-based provider of industrial staffing solutions backed by White Wolf Capital Group and Concentric Equity Partners.
Transaction Structure
Shipyard Staffing, a subsidiary of Workrise, was acquired by NSC Technologies in December 2023. Financial terms were not publicly disclosed.
Market and Customer Segments Combination
The transaction expanded exposure across US industrial, marine, and shipbuilding end markets, combining complementary customer relationships in labor-intensive, project-driven sectors. The combined platform enhanced service capabilities across maintenance, repair, and new-build environments, particularly in coastal and heavy industrial regions.
Acquisition Strategic Rationale
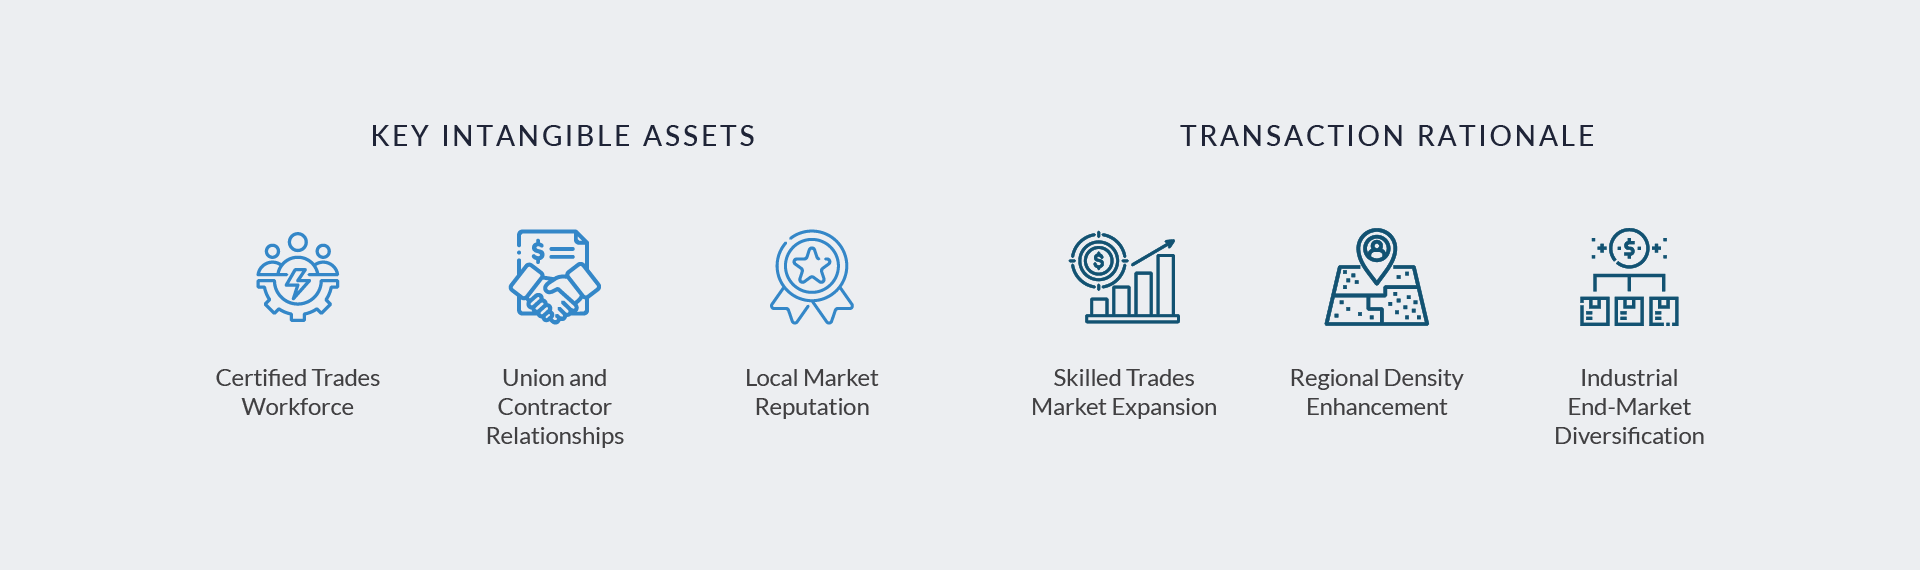
The acquisition strengthened NSC Technologies’ position in skilled trades staffing by expanding its talent base and customer reach within shipbuilding and industrial markets. It supported platform growth through increased scale, enhanced regional density, and an improved ability to service large-scale, project-based labor demand, while reinforcing exposure to stable, non-discretionary industrial end markets.

Case Study 02
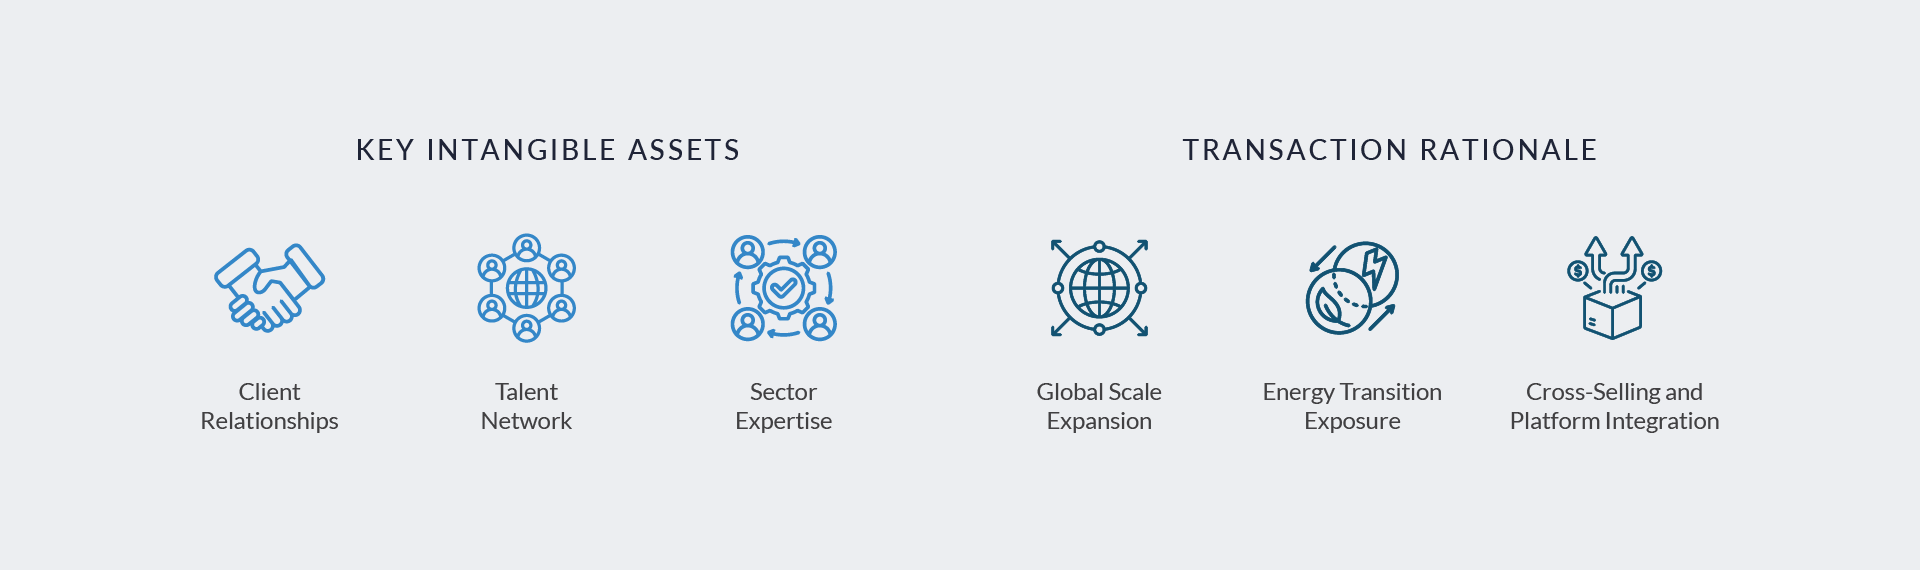
ENERGY RESOURCING
Energy Resourcing is an international workforce solutions provider specializing in technical staffing for energy, natural resources, and industrial sectors. The company delivers recruitment, contractor management, and project-based workforce solutions, supporting the execution of large-scale and technically complex projects. With a global footprint, it sources and manages skilled professionals across engineering, construction, and operations. Its service-based model generates revenue through staffing assignments and workforce management services. Following its acquisition by Airswift, the platform has been integrated to expand geographic reach and enhance capabilities across both traditional and energy transition markets.

Acquirer
Airswift is a global workforce solutions provider focused on the recruitment, deployment, and management of technical talent across energy, infrastructure, and industrial sectors. The company offers contract staffing, permanent placement, and managed workforce services to support complex, project-driven operations. Operating through an international network, Airswift delivers scalable talent solutions across traditional energy and emerging sectors such as renewables. Its revenue model is primarily driven by contractor placements and workforce management services, generating both recurring and project-based income streams.
Transaction Structure
The acquisition of Energy Resourcing was completed by Airswift in August 2023. Financial terms of the transaction were not publicly disclosed.
Market and Customer Segments Combination
The combination brought together complementary exposure across global energy, natural resources, and infrastructure end markets, with an expanded customer base spanning oil and gas, power, renewables, chemicals, and mining. The transaction enhanced diversification across both traditional energy and energy transition sectors, while broadening access to multinational clients and large-scale, project-driven workforce demand.
Acquisition Strategic Rationale
The acquisition strengthened Airswift’s position as a scaled, global provider of technical workforce solutions by expanding geographic reach, deepening sector expertise, and increasing access to skilled talent pools. The transaction supported growth through cross-selling opportunities, improved client penetration, and an enhanced ability to service complex, multi-region projects. Additionally, it reinforced Airswift’s strategy of building a diversified, project-oriented staffing platform with exposure to long-term demand drivers, including energy transition and infrastructure development.

Case Study 03
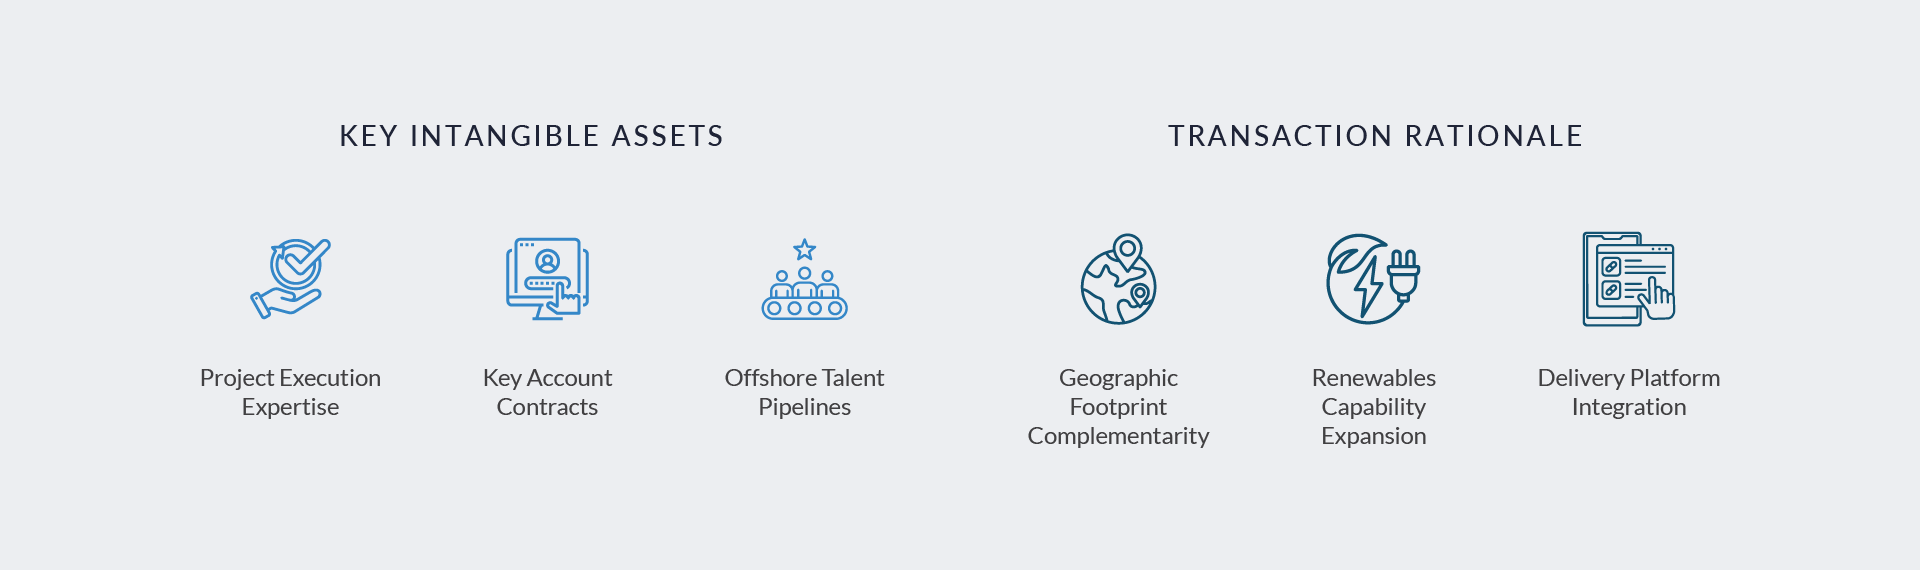
COMPETENTIA
Competentia is a global provider of technical staffing and workforce solutions, offering recruitment, contractor management, and project-based talent services across energy, renewables, and infrastructure sectors. The company supports the sourcing and deployment of skilled engineering and technical professionals for complex, project-driven environments, with capabilities spanning both traditional energy and energy transition markets. Operating through an international network, Competentia delivers scalable, cross-border workforce solutions.

Acquirer
Airswift, a global provider of technical workforce solutions backed by Wellspring Capital Management.
Transaction Structure
Competentia combined with Airswift in June 2021 through a sponsor-backed transaction. Transaction terms were not publicly disclosed.
Market and Customer Segments Combination
The combination expanded exposure across global energy, renewables, and infrastructure markets, integrating complementary client bases and enhancing coverage across both traditional oil and gas and energy transition sectors. The combined platform supported multinational clients with large-scale, project-driven workforce requirements.
Acquisition Strategic Rationale
The transaction strengthened Airswift’s global scale and technical talent capabilities, enabling enhanced service delivery across key geographies and end markets. It supported platform consolidation through increased client penetration, expanded talent pools, and an improved ability to service complex, multi-region projects, while positioning the combined business to benefit from long-term growth in energy transition and infrastructure investment.
As energy transition and infrastructure investment continue to drive demand for skilled labor, workforce solutions providers are critical to the execution of complex, project-driven operations. Sustained M&A activity reflects strong investor conviction in platform-scale providers with established client relationships, recurring workforce utilization, and exposure to non-discretionary end markets.
Looking ahead, acquirers are expected to prioritize scaled, geographically diversified platforms with sector specialization and the ability to support multi-site workforce deployment. Ongoing buy-and-build strategies, supported by continued market fragmentation, are likely to drive further consolidation, with premium valuations concentrated among platforms demonstrating strong revenue visibility, operational scalability, and alignment with long-term energy and infrastructure investment trends.
Source: Airswift (1), (2), SIA (1), (2), PES, Pitchbook Data.