Business Productivity and Language Software
Transactions and Valuations

Between Q1 2020 and Q3 2024, over $113 billion was deployed into the business productivity and language software sector through M&A transactions globally. This vibrant sector encompasses tools and platforms designed to streamline multilingual communication, enable real-time live interpretation, and facilitate AI-driven speech translation and captions for online meetings and virtual events.
The growing demand for business productivity and language software is fueled by global digital transformation and the need for seamless collaboration across borders. Key solutions include cloud-based live interpretation, AI-powered real-time translation, and multilingual meeting platforms that enhance productivity and accessibility for businesses worldwide.
The integration of AI in speech recognition and translation has revolutionized the industry, offering unparalleled efficiency and scalability. Innovations in this space have enabled more personalized, efficient, and accurate communication for virtual events, hybrid meetings, and remote collaboration.
As businesses increasingly operate across linguistic and cultural barriers, the sector is becoming essential for enterprises seeking to maintain global competitiveness. Beyond traditional uses, the rise of virtual and hybrid work environments has expanded the addressable market for these solutions, with sectors like education, healthcare, and government adopting these technologies at an accelerated pace. This diversification underscores the sector’s potential for sustained growth and innovation.
Companies operating in this sector typically trade at enterprise value to revenue multiples of 2x to 14x and EBITDA multiples of 5x to 35x, reflecting the high-growth potential and strategic importance of these solutions. This report highlights trends and valuation benchmarks, showcasing opportunities for buyers and sellers in this dynamic market.


- The valuation multiples are based on a sample set of private and public business productivity and language software companies and M&A transactions in the sector. The data covers Q1 2020 to Q3 2024, providing insights into the financial and operational benchmarks influencing transaction valuations.
- The sample set typically trades at an enterprise value (EV) to revenue multiple range of 2x to 14x, with a mean of 5x and a median of 4x. Companies with higher EVs tend to command larger multiples, reflecting their scale, market leadership, and recurring revenue streams.
- Enterprise value to EBITDA multiples range from 5x to 35x, with a mean of 21x and a median of 20x. These higher multiples demonstrate the sector’s focus on profitability and cash flow, emphasizing the importance of operational efficiency in driving valuations.
- Higher EV/EBITDA multiples suggest that buyers are prioritizing growth potential and strategic value. The emphasis on recurring revenue models, scalability, and synergies plays a crucial role in justifying these valuations.
- M&A activity predominantly concentrates on mid-sized companies, with valuations typically falling in the $10 million to $1 billion EV range. This reflects the sector’s dynamic growth opportunities, where scalable solutions and innovation drive buyer interest.

- Between Q1 2020 and Q3 2024, over $113 billion was invested into the business productivity and language software sector across 2,054 transactions, with an average deal size of approximately $55 million.
- Capital investment in the sector peaked in Q1 2022, with $20 billion invested across 134 deals. This surge was likely driven by post-pandemic growth in demand for productivity and collaboration tools, alongside advancements in AI-powered language solutions. Acquirers targeted transformative software platforms enabling global business efficiency, fueled by the rapid shift toward remote and hybrid work models.
- In Q3 2022, capital investment remained relatively stable, despite a decline in deal volume. This shift reflects a focus on high-value acquisitions of established players with scalable solutions. Strategic buyers prioritized companies with strong recurring revenue models and proprietary technologies, while rising interest rates and higher valuation expectations discouraged smaller deals.
- Q1 2024 saw an increase in capital investment, after 5 quarters of relatively low activity, with $7 billion invested across 108 transactions. This uptick reflects a renewed strategic interest in the sector, likely driven by ongoing demand for advanced business productivity and language software solutions. The increase also suggests that market participants are adjusting to the new economic environment and focusing on high-value acquisitions in response to evolving business needs.
- Q3 2024 continued this momentum, with $7.4 billion invested across 88 transactions, marking another significant period of activity in the sector. While deal count declined slightly compared to Q1 2024, the higher capital investment indicates a focus on fewer, larger deals targeting scalable, high-growth companies. This trend suggests that buyers are prioritizing acquisitions of companies offering innovative AI-driven tools, multilingual communication platforms, and solutions designed to improve global collaboration. The sustained investment levels reflect the sector’s strong fundamentals and its ability to adapt to evolving demands, positioning it for further growth in a competitive market.

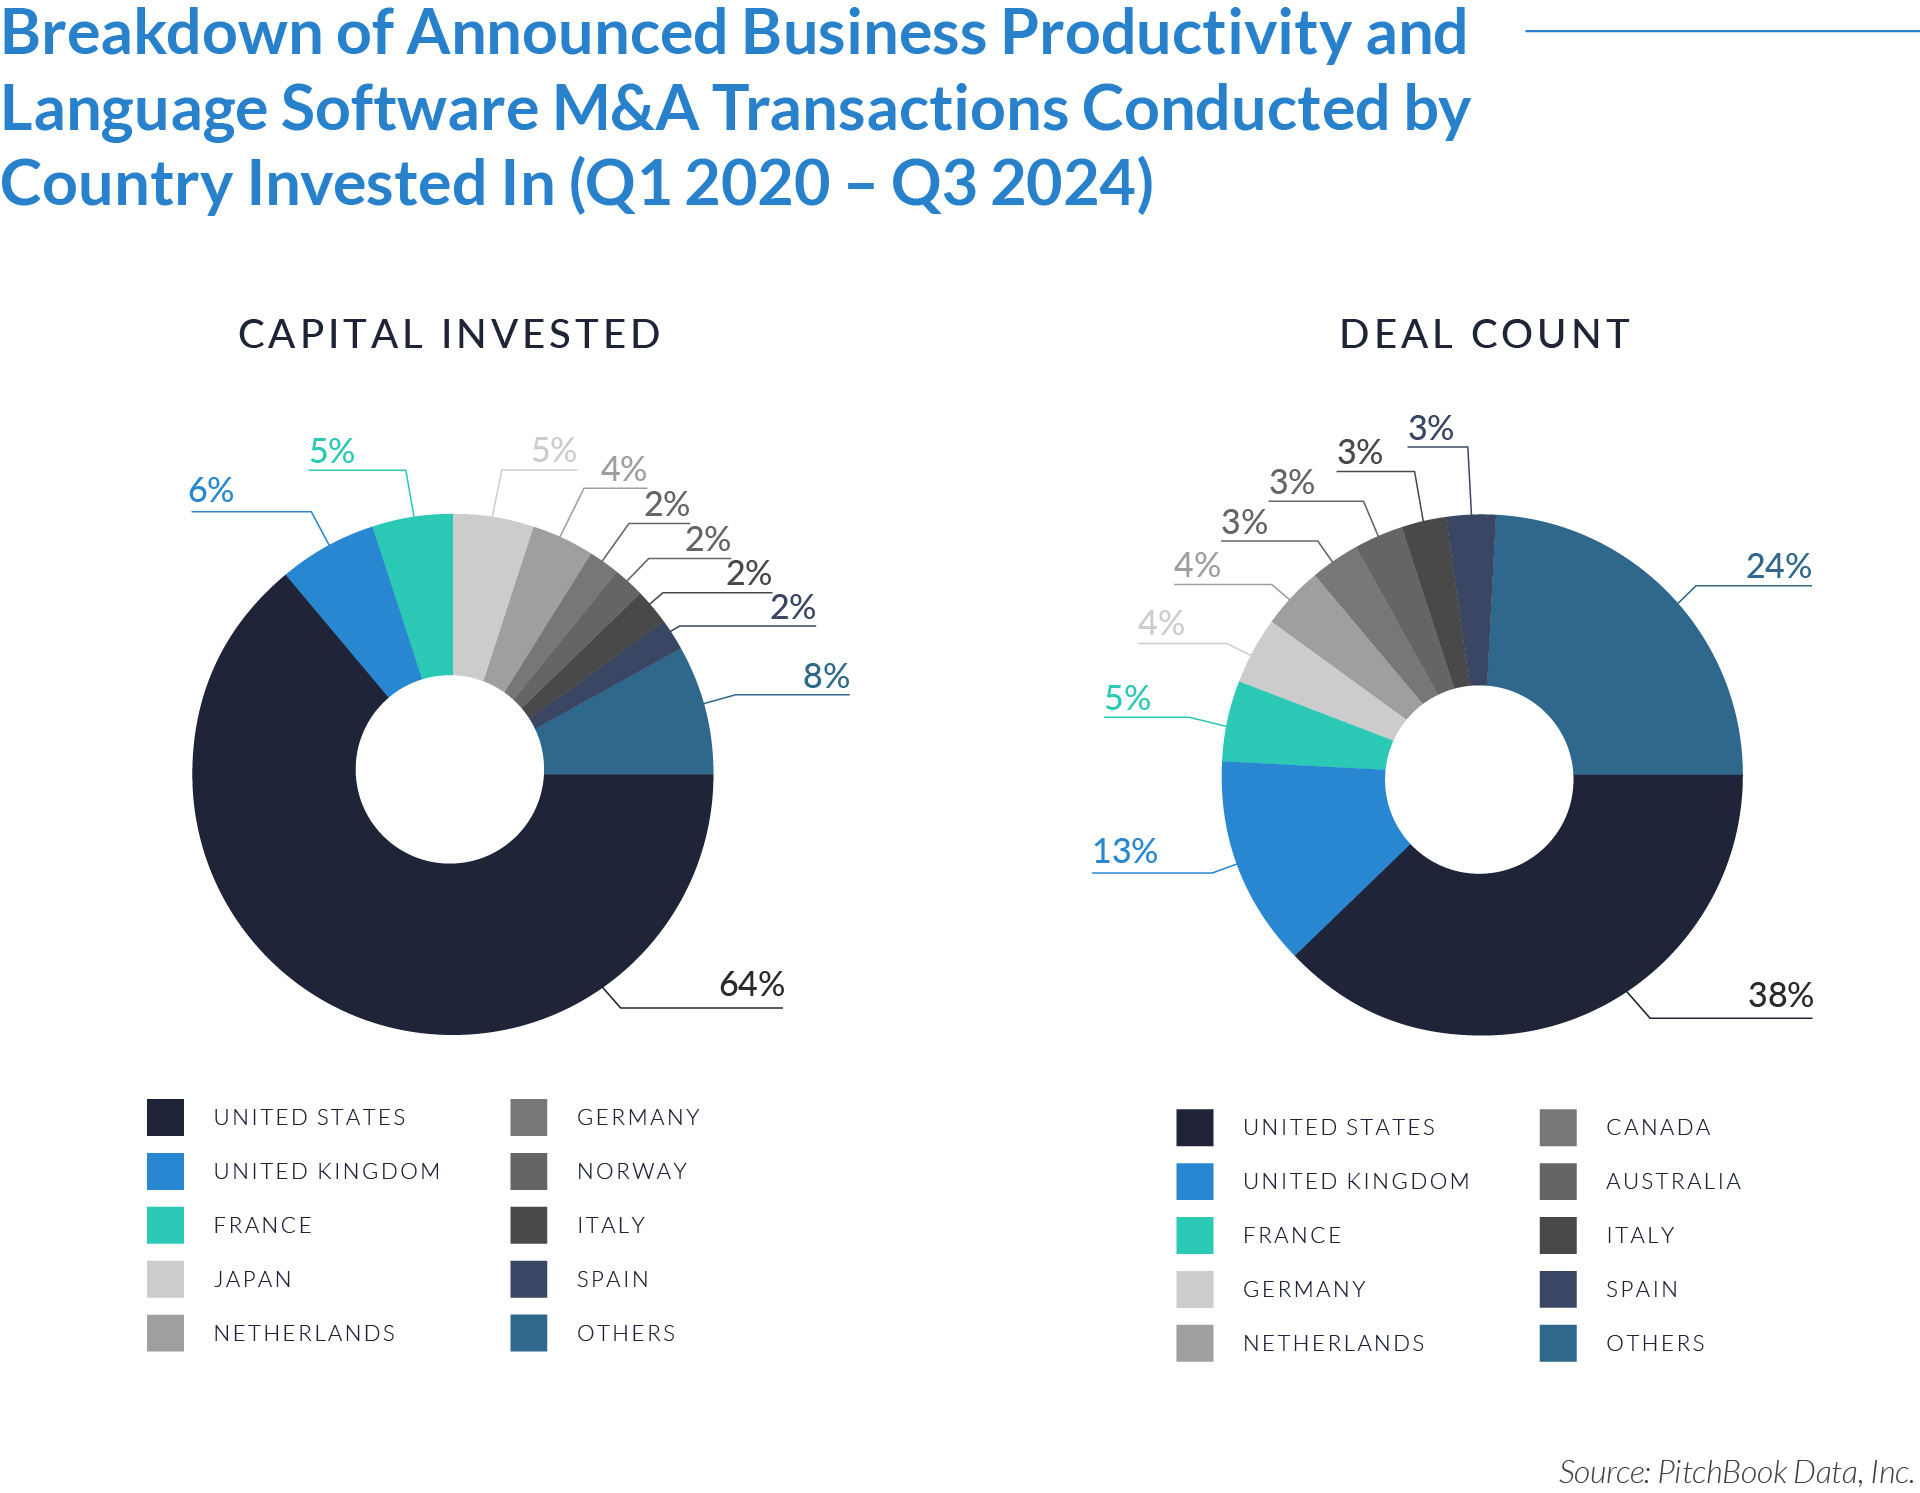
- US-based acquirers led the M&A activity in the business productivity and language software sector, contributing 64% of the total capital invested but only 38% of the total deal count. This disparity highlights the concentration of high-value deals in the US market, underscoring its strategic importance and leadership in technological innovation. The lower share in deal count indicates a significant volume of international transactions.
- The United Kingdom accounted for 6% of capital invested and 13% of deal count, reflecting a fragmented market with numerous smaller transactions. This suggests a vibrant ecosystem of mid-market targets and strategic acquisitions supporting sectoral innovation and regional growth.
- France and Germany contributed similarly to deal activity but diverged in transaction value. France accounted for 5% of both capital invested and deal count, emphasizing balanced activity, while Germany, at 4% of deal count and 2% of capital invested, reflects fewer but larger transactions likely driven by industrial demand for high-value software solutions.
- Smaller markets, such as the Netherlands and Japan, contributed 4% and 5% of capital invested, respectively, with a more modest share in deal count. This activity points to strategic cross-border investments targeting advanced technological capabilities.

- Mergers and acquisitions accounted for $52 billion in capital across 1,256 transactions, making up a significant share of deal activity in the business productivity and language software sector. This highlights the importance of mergers and acquisitions as a strategic tool for consolidating market position, expanding technological capabilities, and acquiring innovative software solutions.
- Buyout/LBO deals contributed $61 billion in capital across 798 transactions, reflecting fewer but higher-value transactions compared to M&A activity. The larger average deal size indicates a focus on mature companies with stable cash flows, as private equity firms sought opportunities to leverage growth potential through financial restructuring.
- M&A transactions represent a higher deal count compared to buyouts, suggesting that many acquirers opted for smaller, targeted acquisitions rather than larger-scale leveraged buyouts. This approach aligns with the sector’s dynamic nature, where strategic technology acquisitions often play a key role in addressing market needs.
- Buyouts involved a greater share of total capital invested despite fewer deals, highlighting the preference for established businesses with strong financial performance. The average deal size for buyouts significantly outpaces that of M&A, reflecting the nature of these transactions as focused on long-term returns and reduced risk exposure.

Deal Spotlight:
SDL
The Company
SDL, a leading provider of language translation and content management software, was acquired by RWS Holdings on November 4, 2020, for $779 million. This acquisition marked a significant consolidation within the language software and localization industry.
The acquisition brought together two major players in the global language and content technology market, creating the largest language services provider worldwide by revenue.
SDL’s strength in machine translation and content management systems complemented RWS’s expertise in intellectual property services and translation.
The transaction was valued at approximately £809 million ($779 million), with a focus on leveraging SDL’s strong recurring revenue streams and expanding RWS’s geographic footprint in key markets, particularly in Europe and North America.
This deal exemplifies the strategic importance of scaling operations and integrating advanced technologies to address evolving client needs in the business productivity and language software space. It set a benchmark for future transactions, highlighting the premium placed on innovation and market leadership in the sector.


The demand for business productivity and language software solutions has shown steady growth and is expected to continue on this trajectory, driven by key trends in globalization and digital transformation. One major driver is the increasing integration of AI and machine learning, which is improving language translation, real-time communication, and overall business efficiency.
Founders and shareholders in the business productivity and language software sector should remain vigilant of market opportunities, as strategic buyers and financial sponsors remain active. While US-based acquirers lead the charge, interest in international markets continues to grow, reflecting the global relevance of these technologies. The sustained appetite for acquisitions highlights the importance of innovation and strategic differentiation for achieving premium valuations.
Source: Zion Market Research, Market Research Future, Statista, Pitchbook.