
The Use of WACC in IoT Sensors, Spectrum, and Semiconductors Valuations for M&A Transactions
The Use of WACC in IoT Sensors, Spectrum, and Semiconductors Valuations for M&A Transactions
Table of Contents
- What Is WACC (Weighted Average Cost of Capital)?
- How WACC Drives Valuation and M&A Outcomes in IoT
- Understanding Risk, Return, and Capital Costs in IoT
- Semiconductors: Capital Structure and Buyer Returns
- Semiconductors: Equity and Debt Matrix Implications for M&A
- Sensors: Cost Structure and Credit Market Position
- Sensors: Equity and Debt Matrix Implications for M&A

The Use of WACC in IoT Sensors, Spectrum, and Semiconductors Valuations for M&A Transactions
Introduction
Weighted Average Cost of Capital (WACC) is a financial metric used in Mergers and Acquisitions (M&A) that directly influences how businesses are valued and financed. In an M&A context, WACC represents the minimum return expected by capital providers for them to invest to support acquisition and fund future growth. It is a forward-looking measure of risk. The greater cost of capital, the greater the perceived buyers perception of risk on the investment. Equity buyers require returns that compensate for ownership risk, while lenders require interest payments that reflect credit quality and debt collection risk.
WACC blends required debt and equity returns based on the ratio of debt and equity used to finance a business. A transaction financed primarily with equity reflects higher return expectations and greater sensitivity to long term performance, while greater use of debt introduces lower capital costs but higher fixed obligations. WACC serves as an indicator of how much a buyer can afford to pay, how a deal can be structured, and whether an acquisition can generate value after financing costs.
Differences in WACC materially influence acquisition pricing and structure. Buyers with lower capital costs can sustain higher valuation multiples, whereas higher WACCs may make deals more difficult to finance or require more conservative acquisition structuring. Comparing these parameters across semiconductors, sensors, and spectrum highlights the important role of capital costs in shaping IoT M&A strategy.
Within the IoT ecosystem, particularly in semiconductors, sensors, and spectrum, this dynamic is especially pronounced. These sectors are capital-intensive, involve long development, and exhibit very different risk and cash flow profiles. Many companies begin with equity-heavy capital structures and gradually introduce debt as their businesses mature and cash flow become more predictable.
What Is WACC (Weighted Average Cost of Capital)?
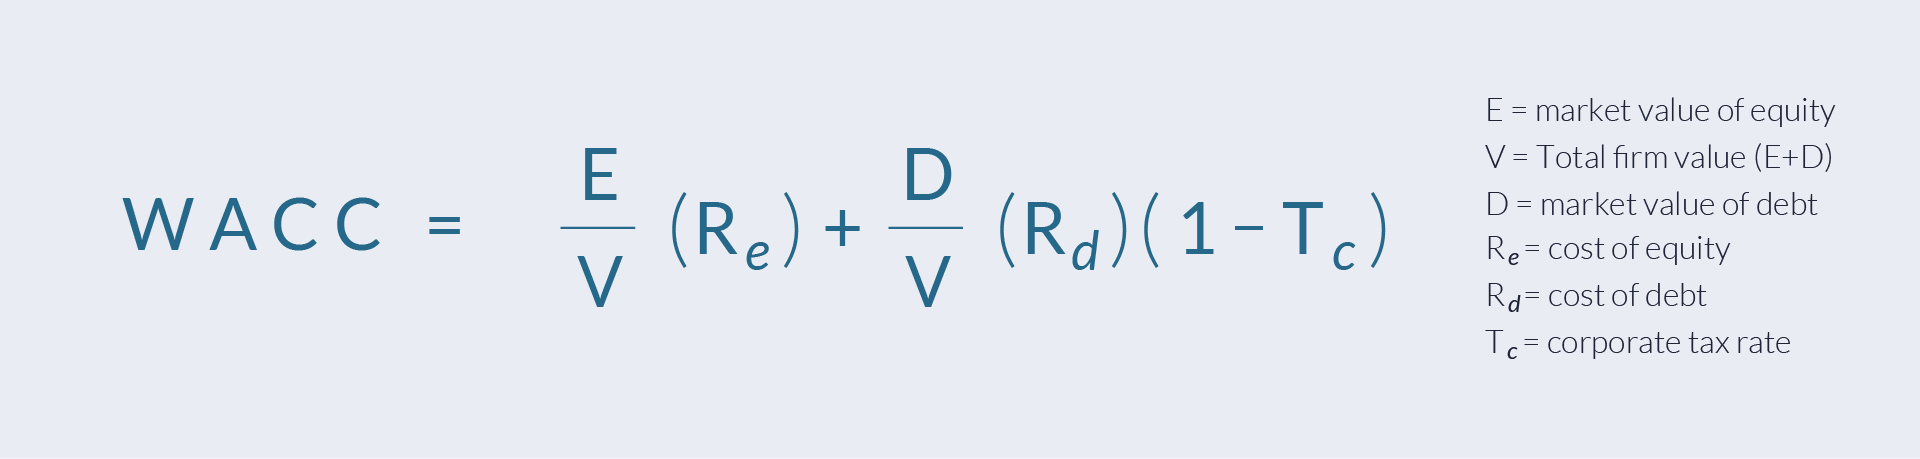
WACC represents the cost a company incurs to compensate all providers of capital, whether through equity or debt financing. Because firms must satisfy both shareholders and creditors, WACC reflects the blended return required by these capital providers. WACC is a combination of these costs weighted to reflect the proportion of debt and equity in the company’s capital structure, giving a single blended rate that reflects a more accurate cost of financing the business.
WACC Formula:
- A higher WACC indicates that buyers require a greater return on their investment. This is typically due to a greater perceived risk or a heavier reliance on financing.
- A lower WACC suggests that the company is able to raise and use capital more efficiently. This is often viewed as a sign of strong business fundamentals, predictable cash flow, and promising growth.
Business size and structure also influence WACC. Larger, well-established, and publicly listed companies typically have a lower cost of capital because they offer greater security, liquidity, and transparency to buyers, reducing perceived risk.
How WACC Drives Valuation and M&A Outcomes in IoT
In M&A, WACC directly affects both valuation and a buyer’s ability to operate and invest in the business after closing the deal. It determines the discount rate used in valuation models and plays an important role in setting the cost at which the combined company can fund operations, service debt, and finance future growth. A higher WACC raises the ongoing cost of capital, limiting financial flexibility post-transaction, while a lower WACC allows buyers to reinvest more aggressively without eroding returns.
Buyers therefore assess WACC not only at the review stage, but in the context of the combined capital structure post-closing. If an acquirer can reduce the target’s cost of capital through lower borrowing costs or a more efficient balance of debt and equity, the business can support higher investment levels after closing. This can justify higher purchase prices, as value is created through improved financing capacity rather than multiple expansion alone.
WACC also impacts deal structure. Transactions that rely heavily on leverage require sufficient cash flow to support interest and principal payments while still funding operating needs. Even modest increases in post-closing capital costs can materially reduce a company’s ability to invest in research, capacity expansion, or integration initiatives. As a result, buyers must evaluate whether the target’s cash flow can sustain both acquisition financing and ongoing operational requirements.
These dynamics are especially relevant in IoT M&A, where capital intensity and risk profiles vary significantly across semiconductors, sensors, and spectrum. Differences in the cost of equity (Re) and the cost of debt (Rd), as well as the capital mix, directly influence the amount of leverage a business can support and the ease with which it can fund growth after an acquisition.
Understanding Risk, Return, and Capital Costs in IoT
IOT industries involve high levels of uncertainty, long development timelines, and large upfront investments. Because of the risk profile, companies in these sectors generally rely heavily on equity in their early stages, given the limited availability of risk-tolerant debt.
This equity-intensive capital stack inflates their WACC, which in turn depresses their valuations under traditional discounted cash flows methodologies. However, as these technologies advance through proof-of-concept and into revenue-generating phases, risk becomes more quantifiable and underwriting more viable. This progression enables the introduction of lower-cost debt, which can reduce WACC and unlock more favorable valuation multiples buyers.
In the sections that follow, we focus on three core variables that shape capital costs across the IoT landscape:


Together, these factors determine a company’s weighted average cost of capital buyers. Understanding the interplay among these variables is essential in IoT M&A, where capital structure affects not only valuation, but also a buyer’s capacity to finance future growth. A lower WACC can increase a potential buyer’s ability to pay a premium, while a higher WACC may constrain acquisition appetite or require more conservative deal structures. By analyzing how these elements differ across semiconductors, sensors, and spectrum, we can better understand how capital costs drive strategic decisions in IoT-focused transactions.

Semiconductors
Within the IoT ecosystem, semiconductors form the foundation for data processing, connectivity, and system performance. That foundational role can support a lower risk profile for established semiconductor firms, particularly those with diversified customers and predictable demand.
The semiconductor industry includes a diverse mix of business models. Companies such as NVIDIA, AMD, Qualcomm, and Broadcom rely heavily on intellectual property and outsourced manufacturing, while integrated device manufacturers like Intel, Texas Instruments, and Micron manage both design and production. Foundries such as GlobalFoundries provide manufacturing capacity for others. These different models lead to distinct capital structures and costs of capital.
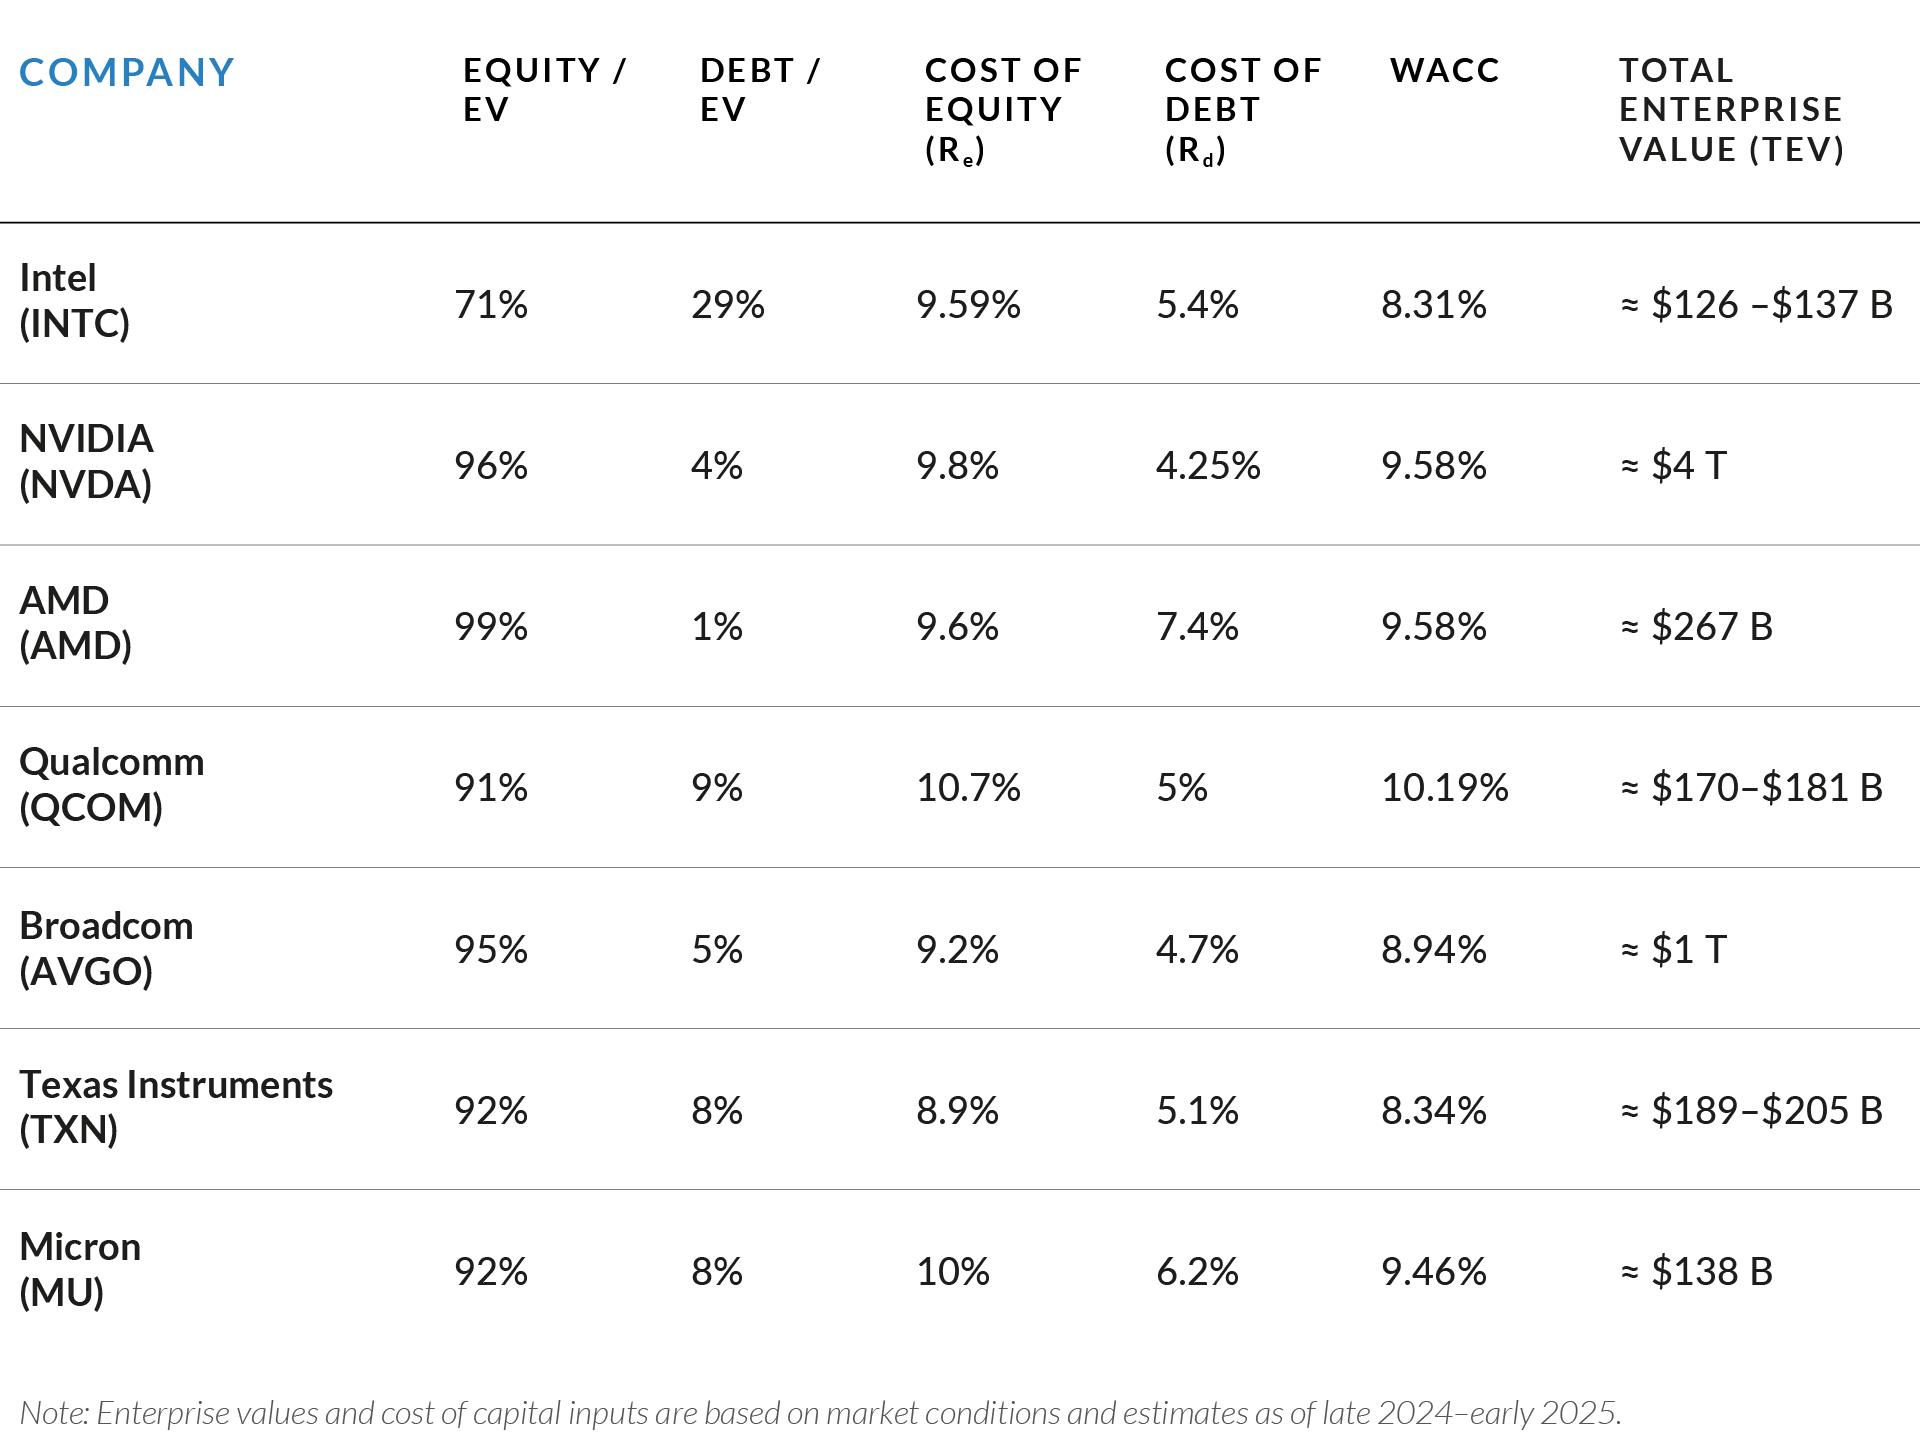
These semiconductor leaders display meaningful differences in their capital structures and costs of capital. Firms such as NVIDIA (96% equity) and AMD (99% equity) are financed predominantly through equity and exhibit WACCs of approximately 9.58%, while Intel, with a greater proportion of debt in its capital mix, reports a lower WACC of 8.31%.
These contrasts reflect differences in business model and financial profile rather than a simple preference for one form of capital over another. Asset-light, IP-focused companies such as NVIDIA and AMD generate high margins and strong growth, but their earnings are closely tied to technological leadership and cyclical end markets. This creates greater earnings variability and limits the predictability required to support significant leverage. As a result, these firms tend to operate with minimal debt, prioritizing flexibility over balance sheet leverage.
In contrast, Intel’s integrated manufacturing model requires substantial fixed investment in fabrication facilities and equipment. While capital-intensive, this structure also provides tangible assets and more stable operating cash flows, supporting greater use of debt financing. Access to secured borrowing at comparatively lower cost reduces its blended cost of capital and results in a lower WACC.
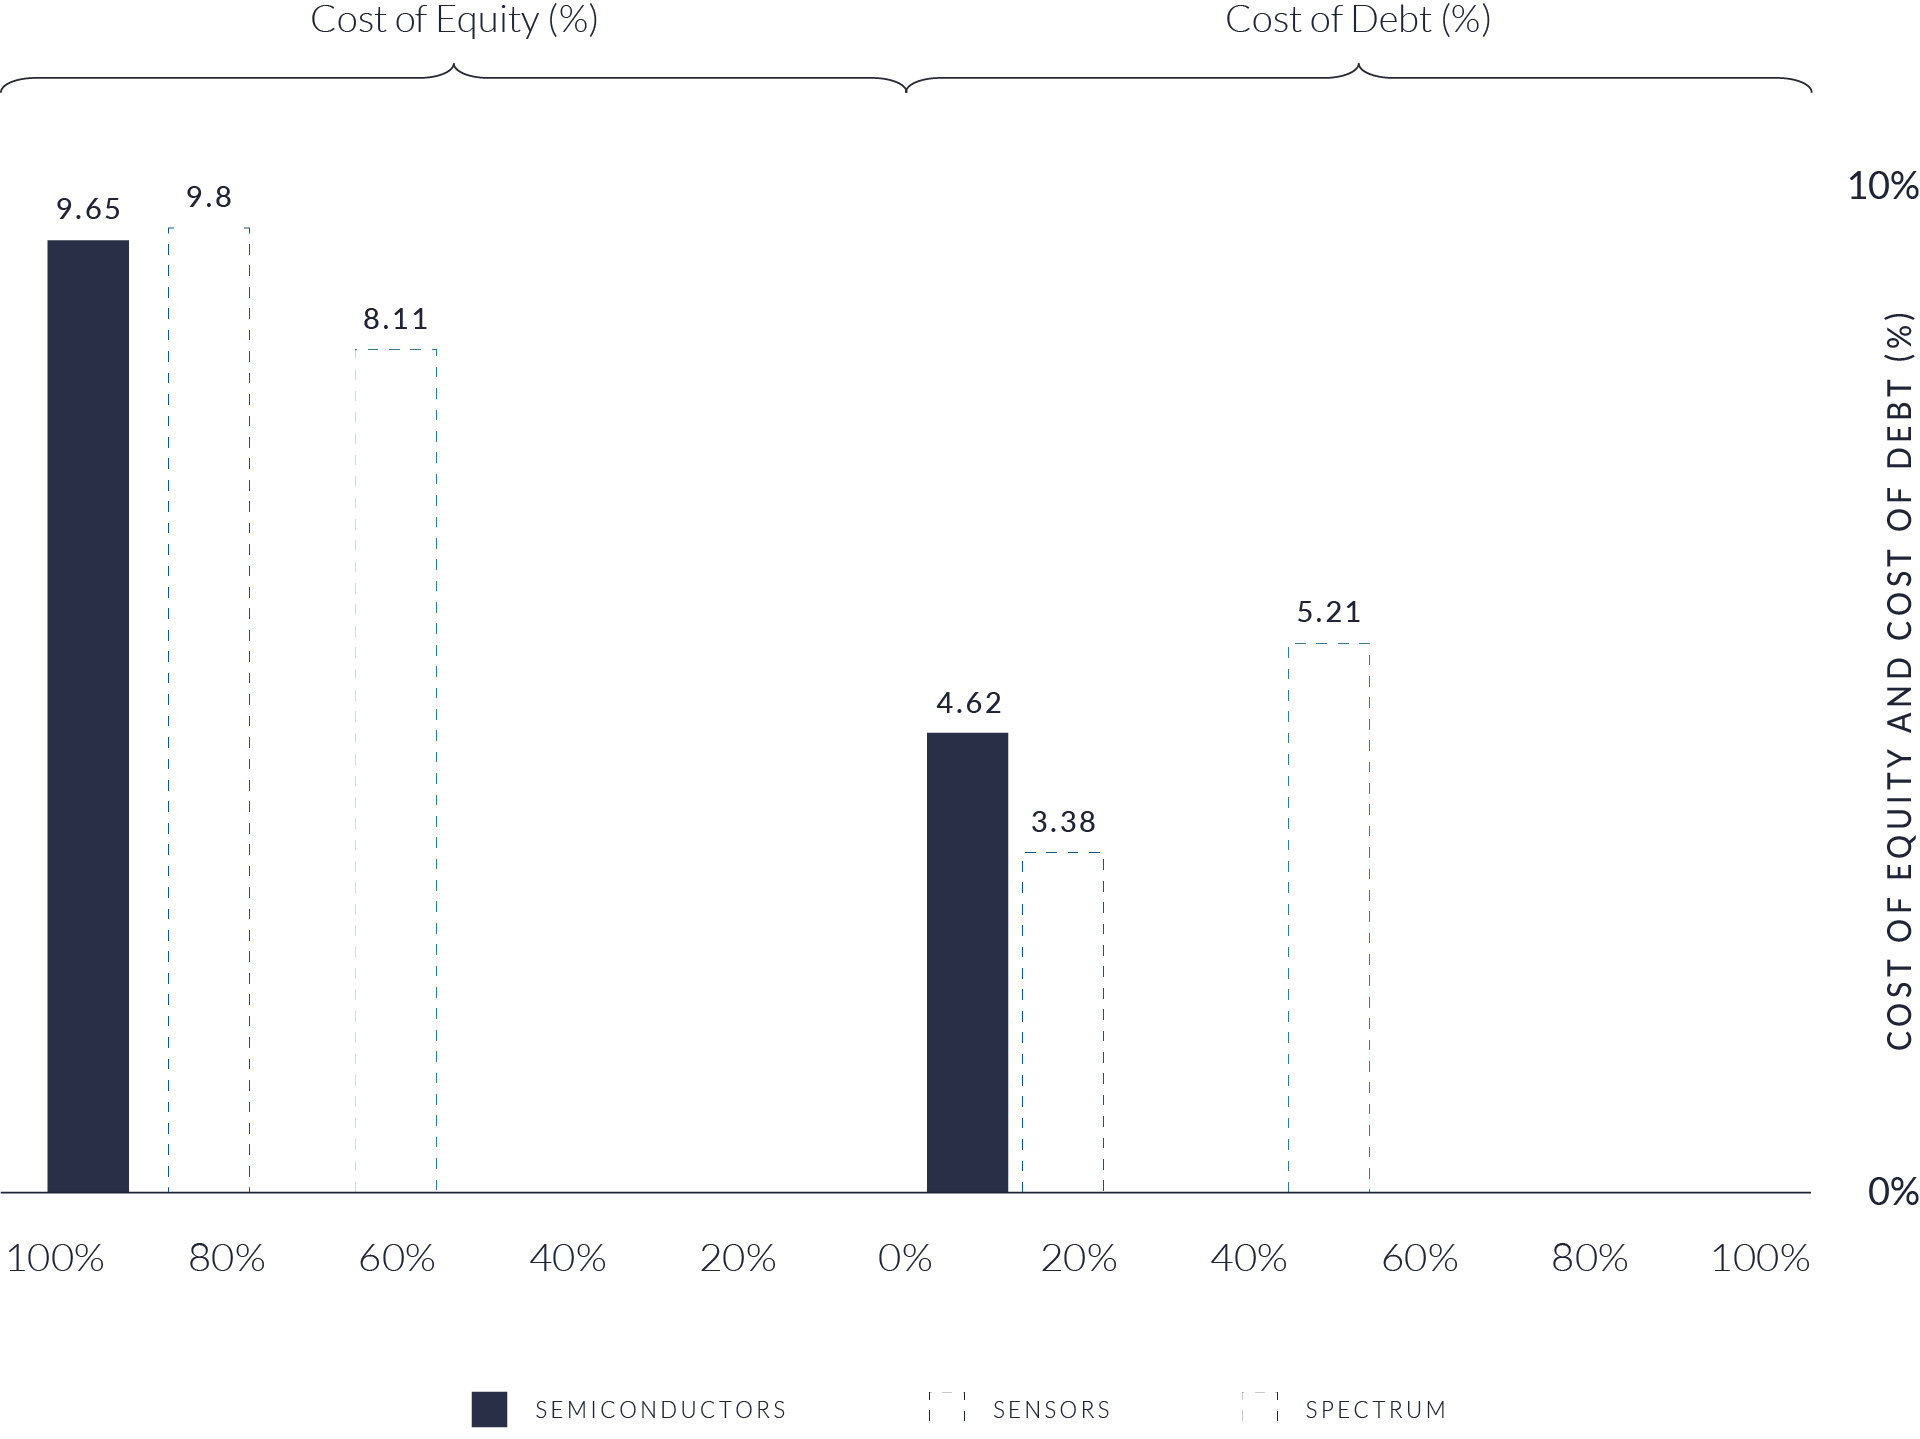
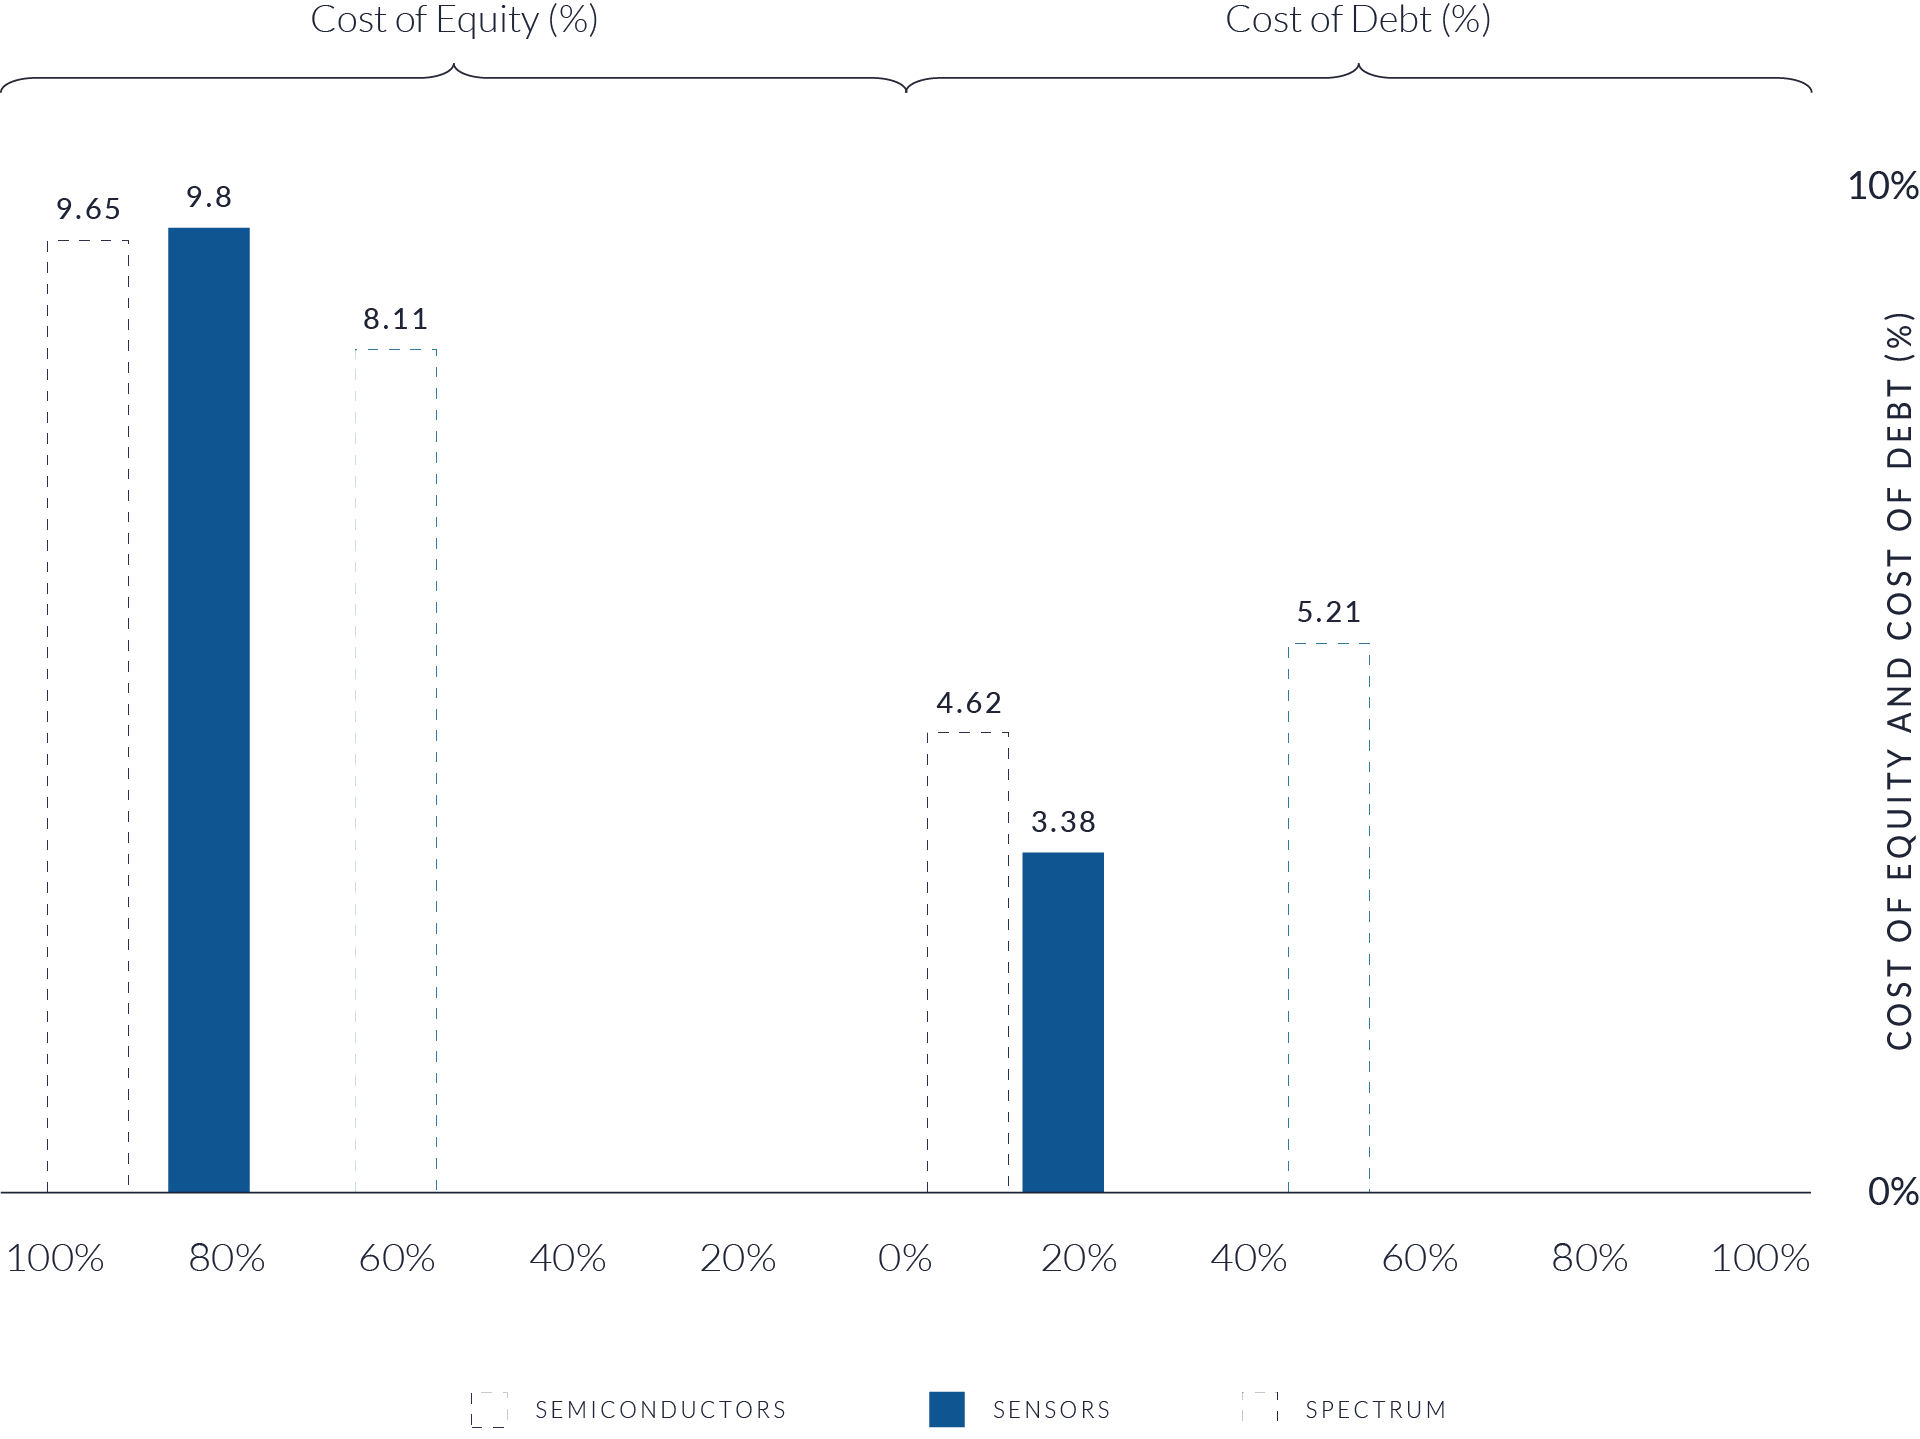
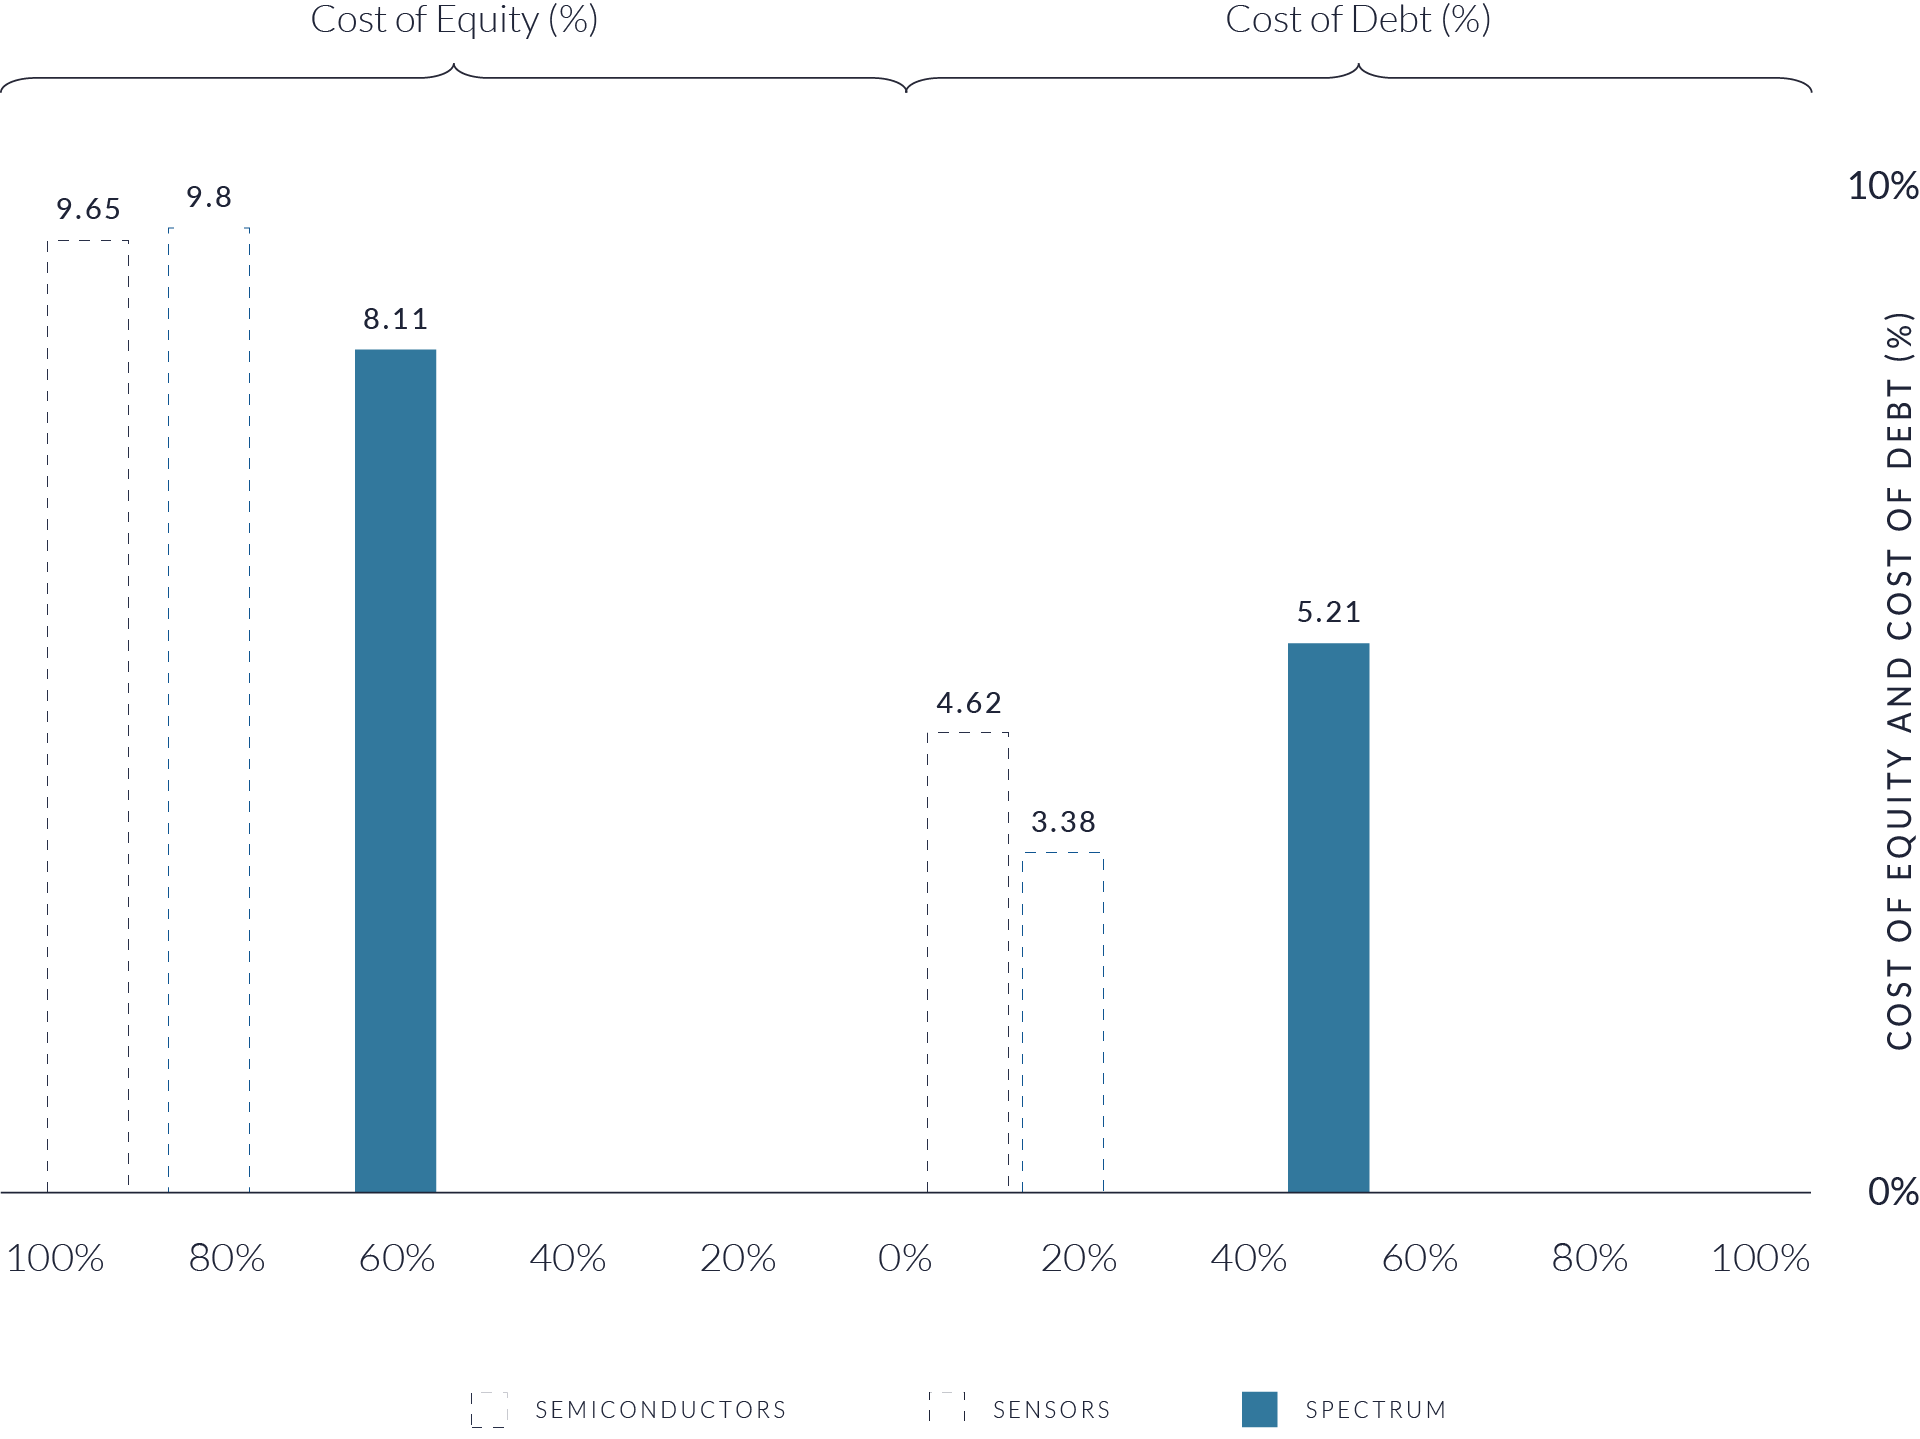
The figure above compares equity concentration of TEV, debt concentration of TEV, cost of equity (Re), and cost of debt (Rd) across ten representative semiconductor firms. Collectively, the group is overwhelmingly equity-financed, with equity comprising nearly 95% of total enterprise value versus approximately 5% debt. This structure reflects both growth-oriented capital allocation and generally conservative use of leverage within the sector. The average cost of equity (9.65%) materially exceeds the average cost of debt (4.62%), illustrating the return premium demanded by equity buyers. Together, these companies represent a combined enterprise value of approximately $6.7 trillion, underscoring the scale and strategic importance of the global semiconductor industry.
Semiconductors: Capital Structure and Buyer Returns
Semiconductor companies have built their capital structures around equity financing, reflecting the sector’s long investment cycles and exposure to technological shifts. With the surge in demand driven by artificial intelligence, data infrastructure, and high-performance computing, buyers have increasingly valued growth potential over profit margins. As a result, the industry remains predominantly equity-financed, with about 95% of total enterprise value represented by equity and roughly 5% by debt. This structure provides flexibility during periods of volatility and reduces exposure to interest rate fluctuations, but it also results in a relatively high weighted average cost of capital (WACC). The average cost of equity (Re) across the sector is approximately 9.65%, compared with an Rd near 4.62%. These figures should not be viewed as directly comparable financing costs. The Re represents the return buyers expect based on perceived risk, growth prospects, and market conditions, while Rd reflects contractual borrowing terms.
A higher Re reflects buyer expectations of future returns in a sector characterized by rapid innovation and earnings volatility. Debt financing, while nominally cheaper, introduces potentially cash flow constraining fixed obligations and amplifies financial risk, which in turn raises the required return on equity. The relationship between the two determines a company’s optimal WACC balance at which risk and return are efficiently aligned.
In this context, the semiconductor sector’s reliance on equity signals buyer confidence in sustained innovation and cash flow growth rather than a failure to optimize leverage. High equity weighting allows firms to fund multi-year R&D programs and capacity expansions without compromising balance sheet flexibility. From a valuation perspective, buyers price this stability and growth potential into forward-looking return expectations, which explains why the sector’s WACC remains above that of more asset-backed IoT segments such as spectrum. Higher Re mirrors the market’s perception of technological risk and long-term opportunity.
For M&A, high reliance on equity places greater emphasis on long term growth. Acquirers with lower costs of capital or strong balance sheets are better positioned to pay premiums and fund ongoing research and capacity investment post-acquisition, while buyers dependent on heavy leverage may face constraints in these same parameters.
Why Do Semiconductors Have Higher Equity Concentration than Sensors or Spectrum?
Semiconductors have seen a sharp rise in equity value, largely due to the explosive growth in AI and high-performance computing. These trends have drawn enormous equity investment, boosting valuations and increasing equity share relative to debt.
Equity buyers generate returns through dividends or stock growth. Buyers in the semiconductor sector are expecting AI to lead to a significantly increased market capitalization for high-performing players in the sector.
The industry operates in a high-growth, high-capex environment, where companies such as NVIDIA fund multi-billion-dollar R&D cycles, long product lifecycles, and volatile market demand. In such conditions, equity financing is more practical than debt, as lenders are reluctant to underwrite long payback horizons. Buyers want to own the upside in platforms powering AI and autonomous systems, which further fuels the preference for equity.
Semiconductors: Equity and Debt Matrix Implications for M&A
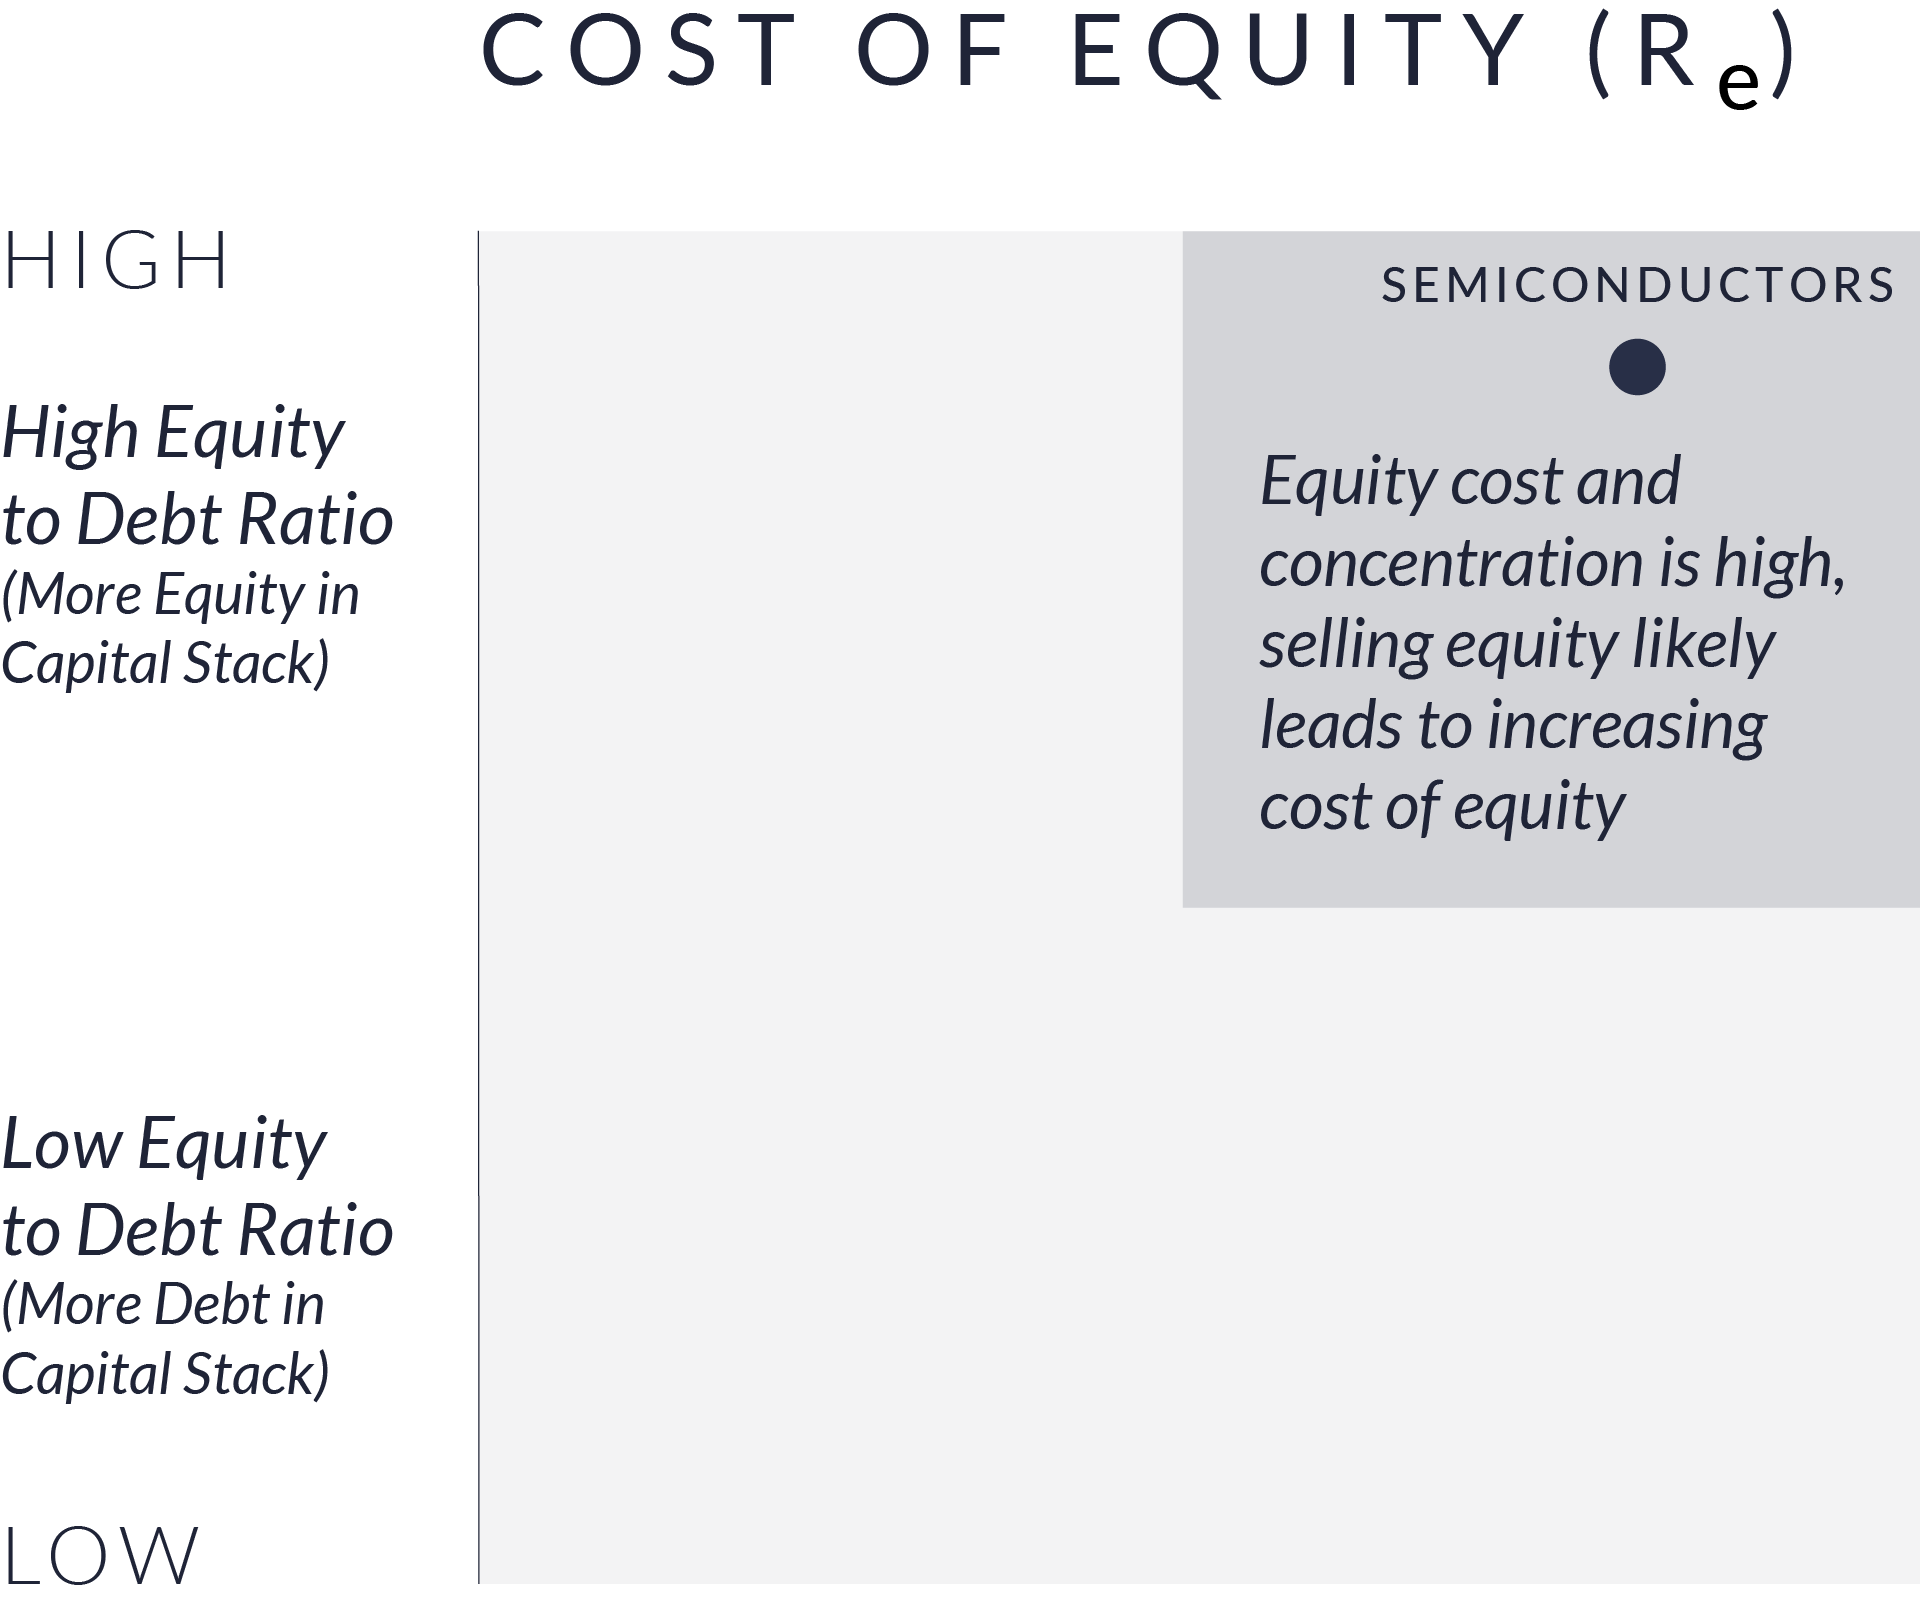
In the equity matrix, semiconductor companies fall into the quadrant where both the cost of equity (Re) and the share of equity in the capital structure are high. This reflects buyers’ confidence in the sector’s long-term growth potential and their expectation that returns will match the pace of ongoing innovation. Because equity plays such a central role in semiconductor valuations, M&A transactions in this sector are typically based on a forward-looking view of technological development, market expansion, and future earnings potential. Buyers are often willing to support high valuations, but only when they believe the company can sustain its competitive position or benefit from broader industry growth trends.
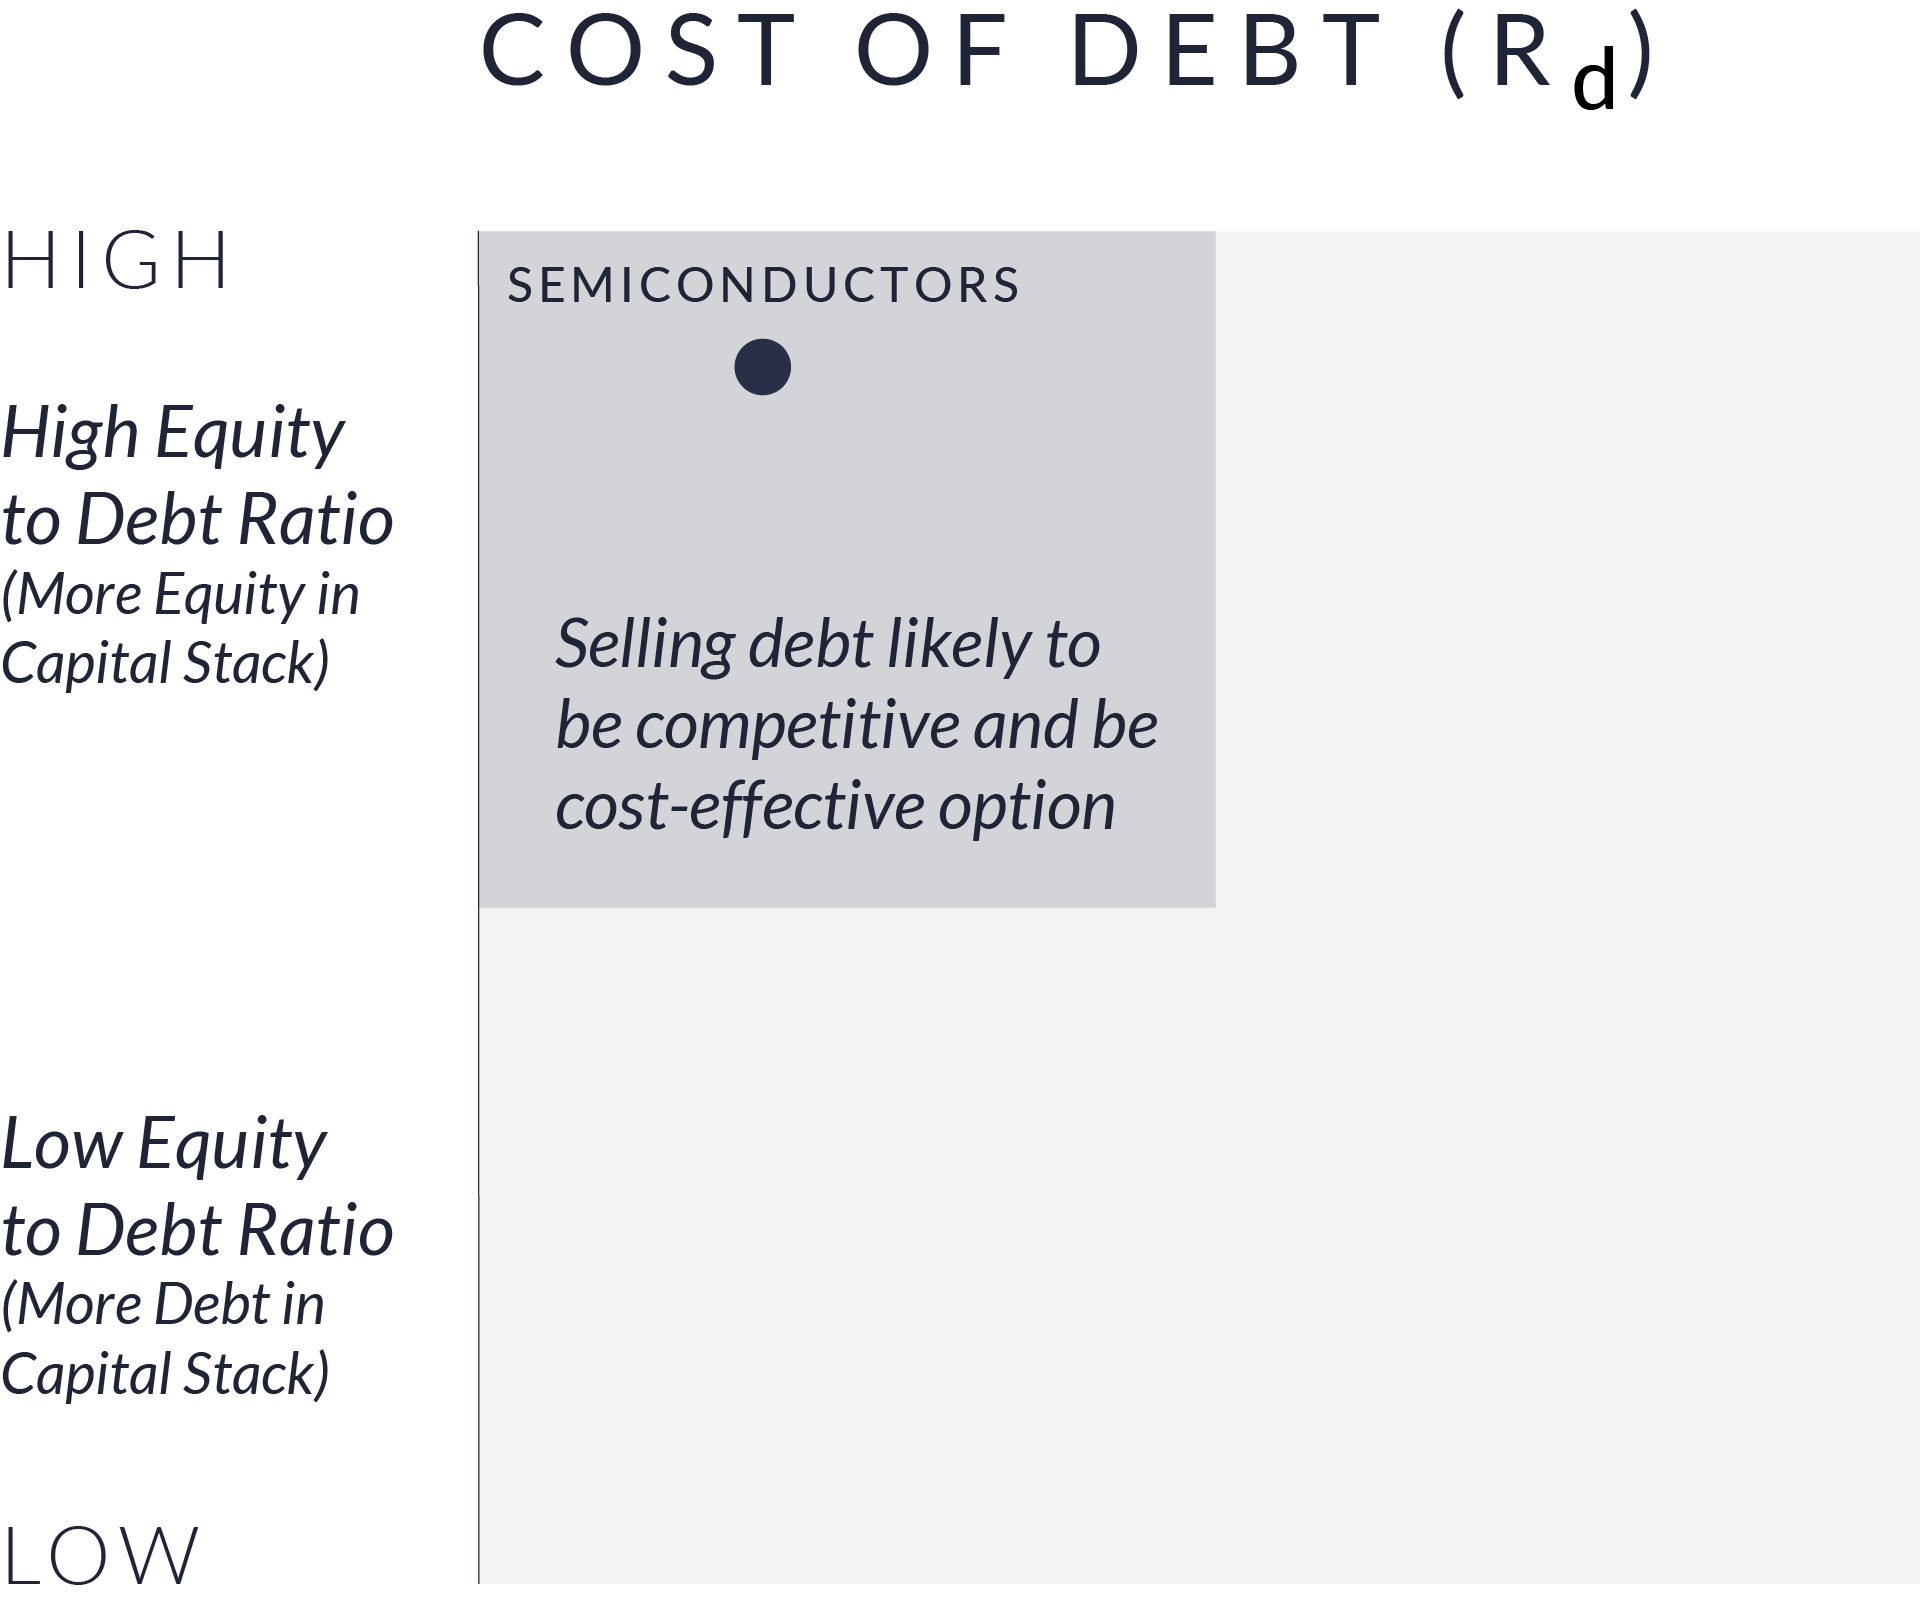
In the debt matrix, semiconductors appear in the position where debt levels are relatively low and borrowing costs are higher compared with other IoT segments. This reflects lenders’ recognition that the industry’s long development cycles and investment requirements introduce variability in financial performance as it relates to their ability to service debt. While companies in this sector have the capacity to use debt, it is used in a supporting rather than leading role in transaction financing. For acquirers, this means that well-capitalized buyers or those with lower borrowing costs are better positioned to pursue larger transactions, while highly leveraged deal structures are less common. Overall, financing strategies in semiconductor M&A relies on equity funds and long-term value creation than on aggressive use of leverage.

Sensors
Within the IoT ecosystem, sensors are the front end of data generation and collection, enabling connectivity across automotive, industrial, healthcare, and consumer applications. Sensor companies are critical to IoT scalability but face unique financing and market challenges because they operate at the interface between physical and digital systems. Their businesses are generally less capital-intensive than semiconductors but more fragmented, which shapes both their capital structures and cost of capital.
The sensor industry includes a wide range of companies. Amphenol and Allegro Microsystems focus on component manufacturing and integration, while TE Connectivity serves large-scale industrial and automotive markets. Garmin and Trimble specialize in positioning, measurement, and navigation technologies, while Keysight Technologies focuses on electronic testing and measurement systems. These different operating models lead to varying financial profiles, levels of leverage, and WACCs.
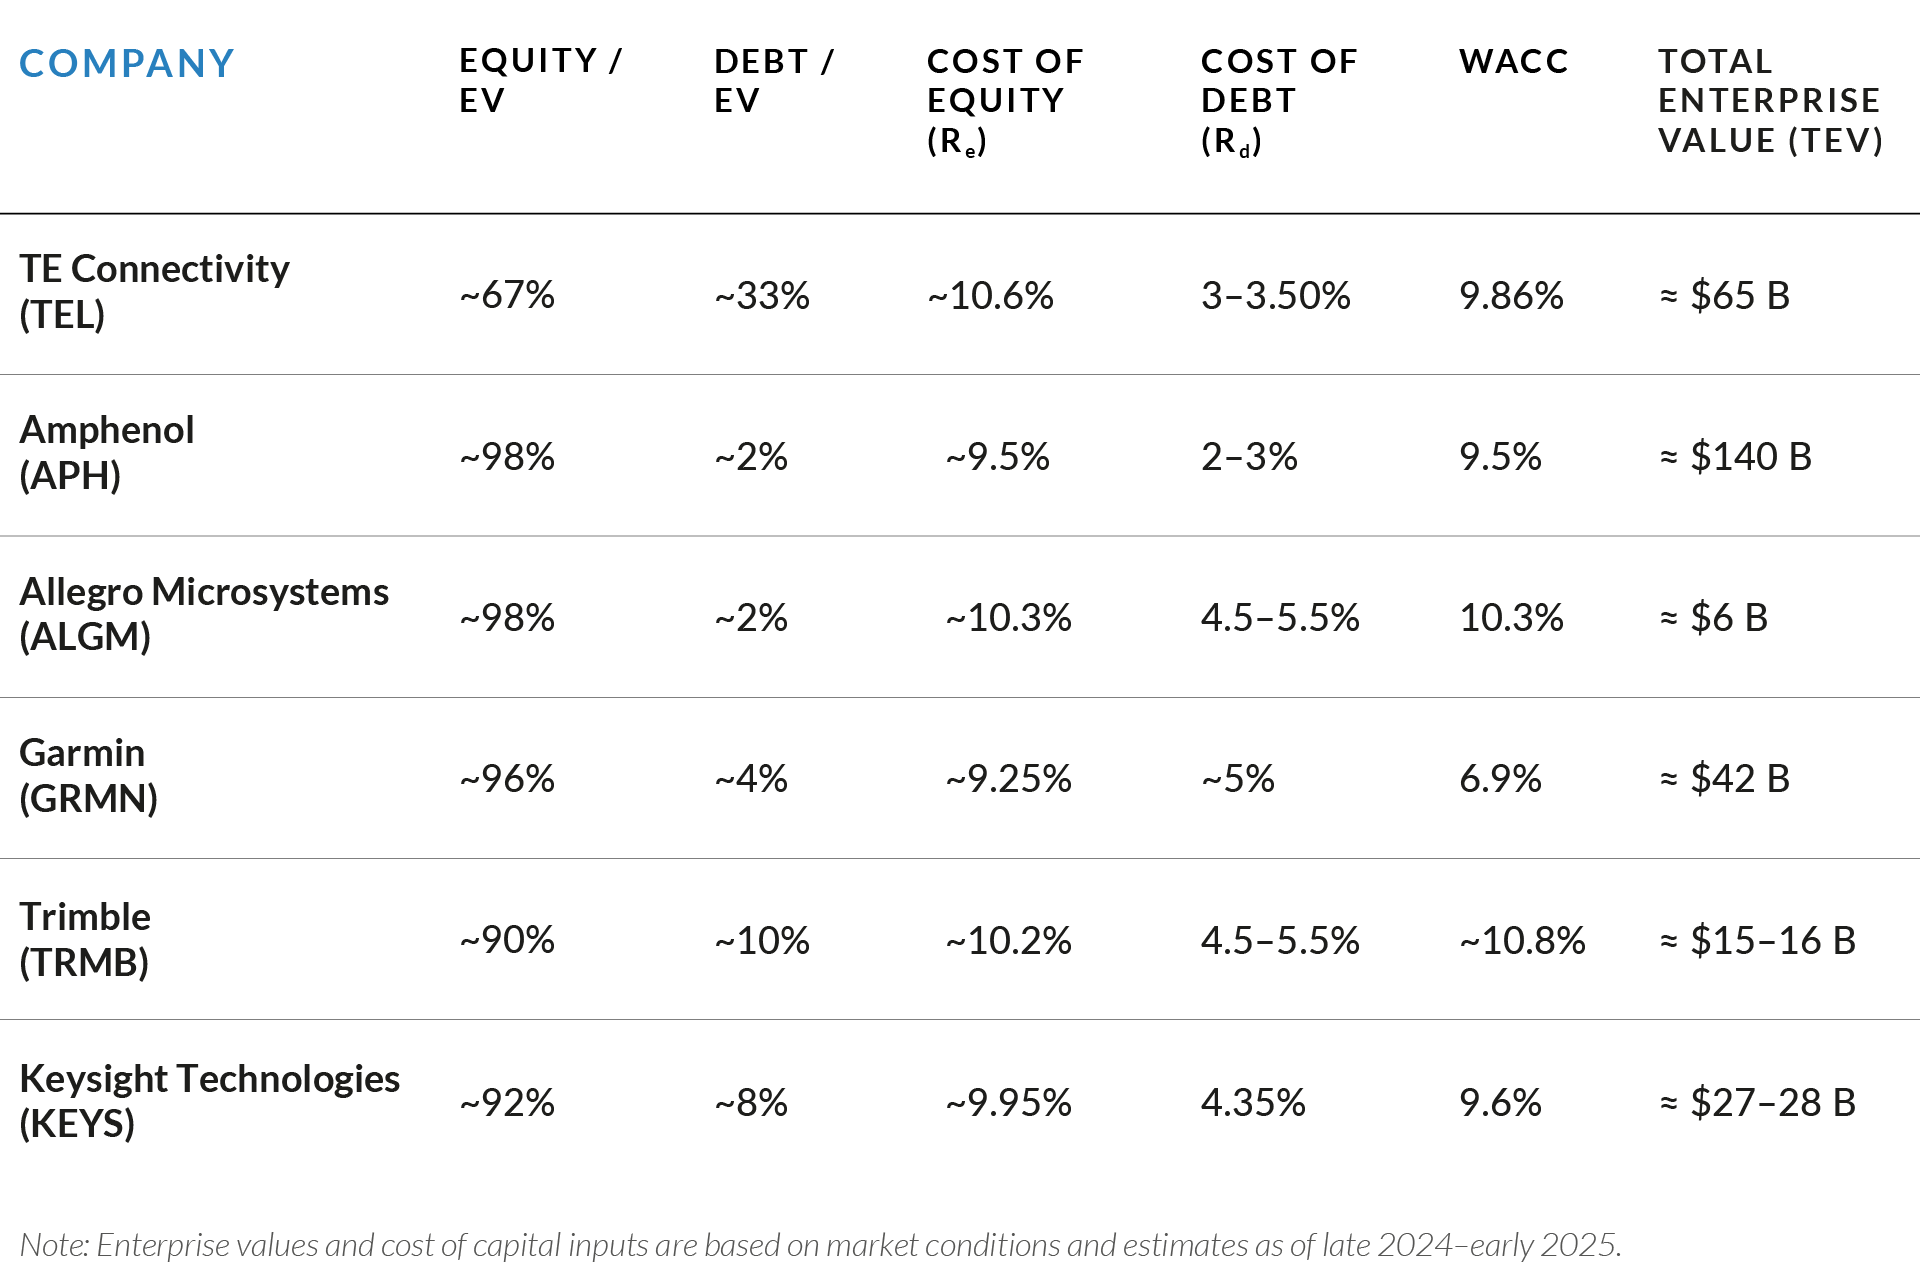
As shown in the figure above, sensor companies are primarily equity-financed, with an average equity concentration of about 90% of total enterprise value (TEV) and debt making up roughly 10%. This mix reflects buyer confidence in long-term IoT adoption but limited use of borrowing across the group. The average cost of equity (Re) is approximately 9.8%, compared to a much lower average cost of debt (Rd) of 3.4%, resulting in a weighted average cost of capital near 9.5%.
Across individual companies, financing strategies vary significantly. TE Connectivity, with 67% equity and 33% debt, achieves a WACC of 9.86%, while Amphenol and Allegro Microsystems, both with around 98% equity, carry WACCs between 9.5% and 10.3%. Larger diversified players like Amphenol (TEV ≈ $140B) benefit from scale and stable demand, whereas smaller innovators like Allegro (TEV ≈ $6B) face higher financing costs due to size and concentration risk.
Collectively, the sensor peer group represents a combined enterprise value of roughly $298 billion. The sector’s high equity weighting and relatively consistent WACC suggest that buyers continue to view sensors as growth-driven, moderately risky assets within the IoT stack.
Sensors: Cost Structure and Credit Market Position
Sensor companies occupy a unique position within the IoT landscape, bridging high-growth technology segments and established industrial markets. Their capital structures and cost of capital reflect this middle ground, balancing moderate risk with steady demand across automotive, industrial, and communications applications.
The sector’s average Re is approximately 9.8%, the highest among the three IoT sub-sectors. This elevated return expectation indicates that buyers view sensors as growth-oriented but exposed to competitive and economic pressures. Many companies operate in fragmented markets with limited pricing power, and product differentiation often depends on incremental innovation or integration with larger platforms. These dynamics create earnings uncertainty, leading equity buyers to demand higher expected returns.
At the same time, the average Rd stands at roughly 3.4%, the lowest across the IoT peer set. This reflects lenders’ perception that sensor companies, despite their equity volatility, exhibit stable credit fundamentals. Many sensor manufacturers generate consistent cash flows, maintain moderate leverage, and serve diversified end markets, which translates to strong credit profiles and favorable borrowing terms. This combination of high Re and low Rd highlights that sensor valuations are shaped more by competition intensity, margin pressure, and end-market diversification.
For M&A buyers, the sensor sector presents an opportunity where value creation is driven by expanding operational reach, refining product offerings, and allocating capital with discipline. The combination of operational risk and credit stability makes sensor businesses well-suited for transactions that emphasize integration synergies, cost efficiency, and selective use of leverage rather than pure growth. Buyers that can consolidate fragmented product lines, improve pricing discipline, or leverage existing distribution and customer relationships are best positioned to enhance returns. As a result, sensor M&A tends to favor acquirers with strong operational execution capabilities and the ability to use debt prudently to support post-closing integration and expansion.
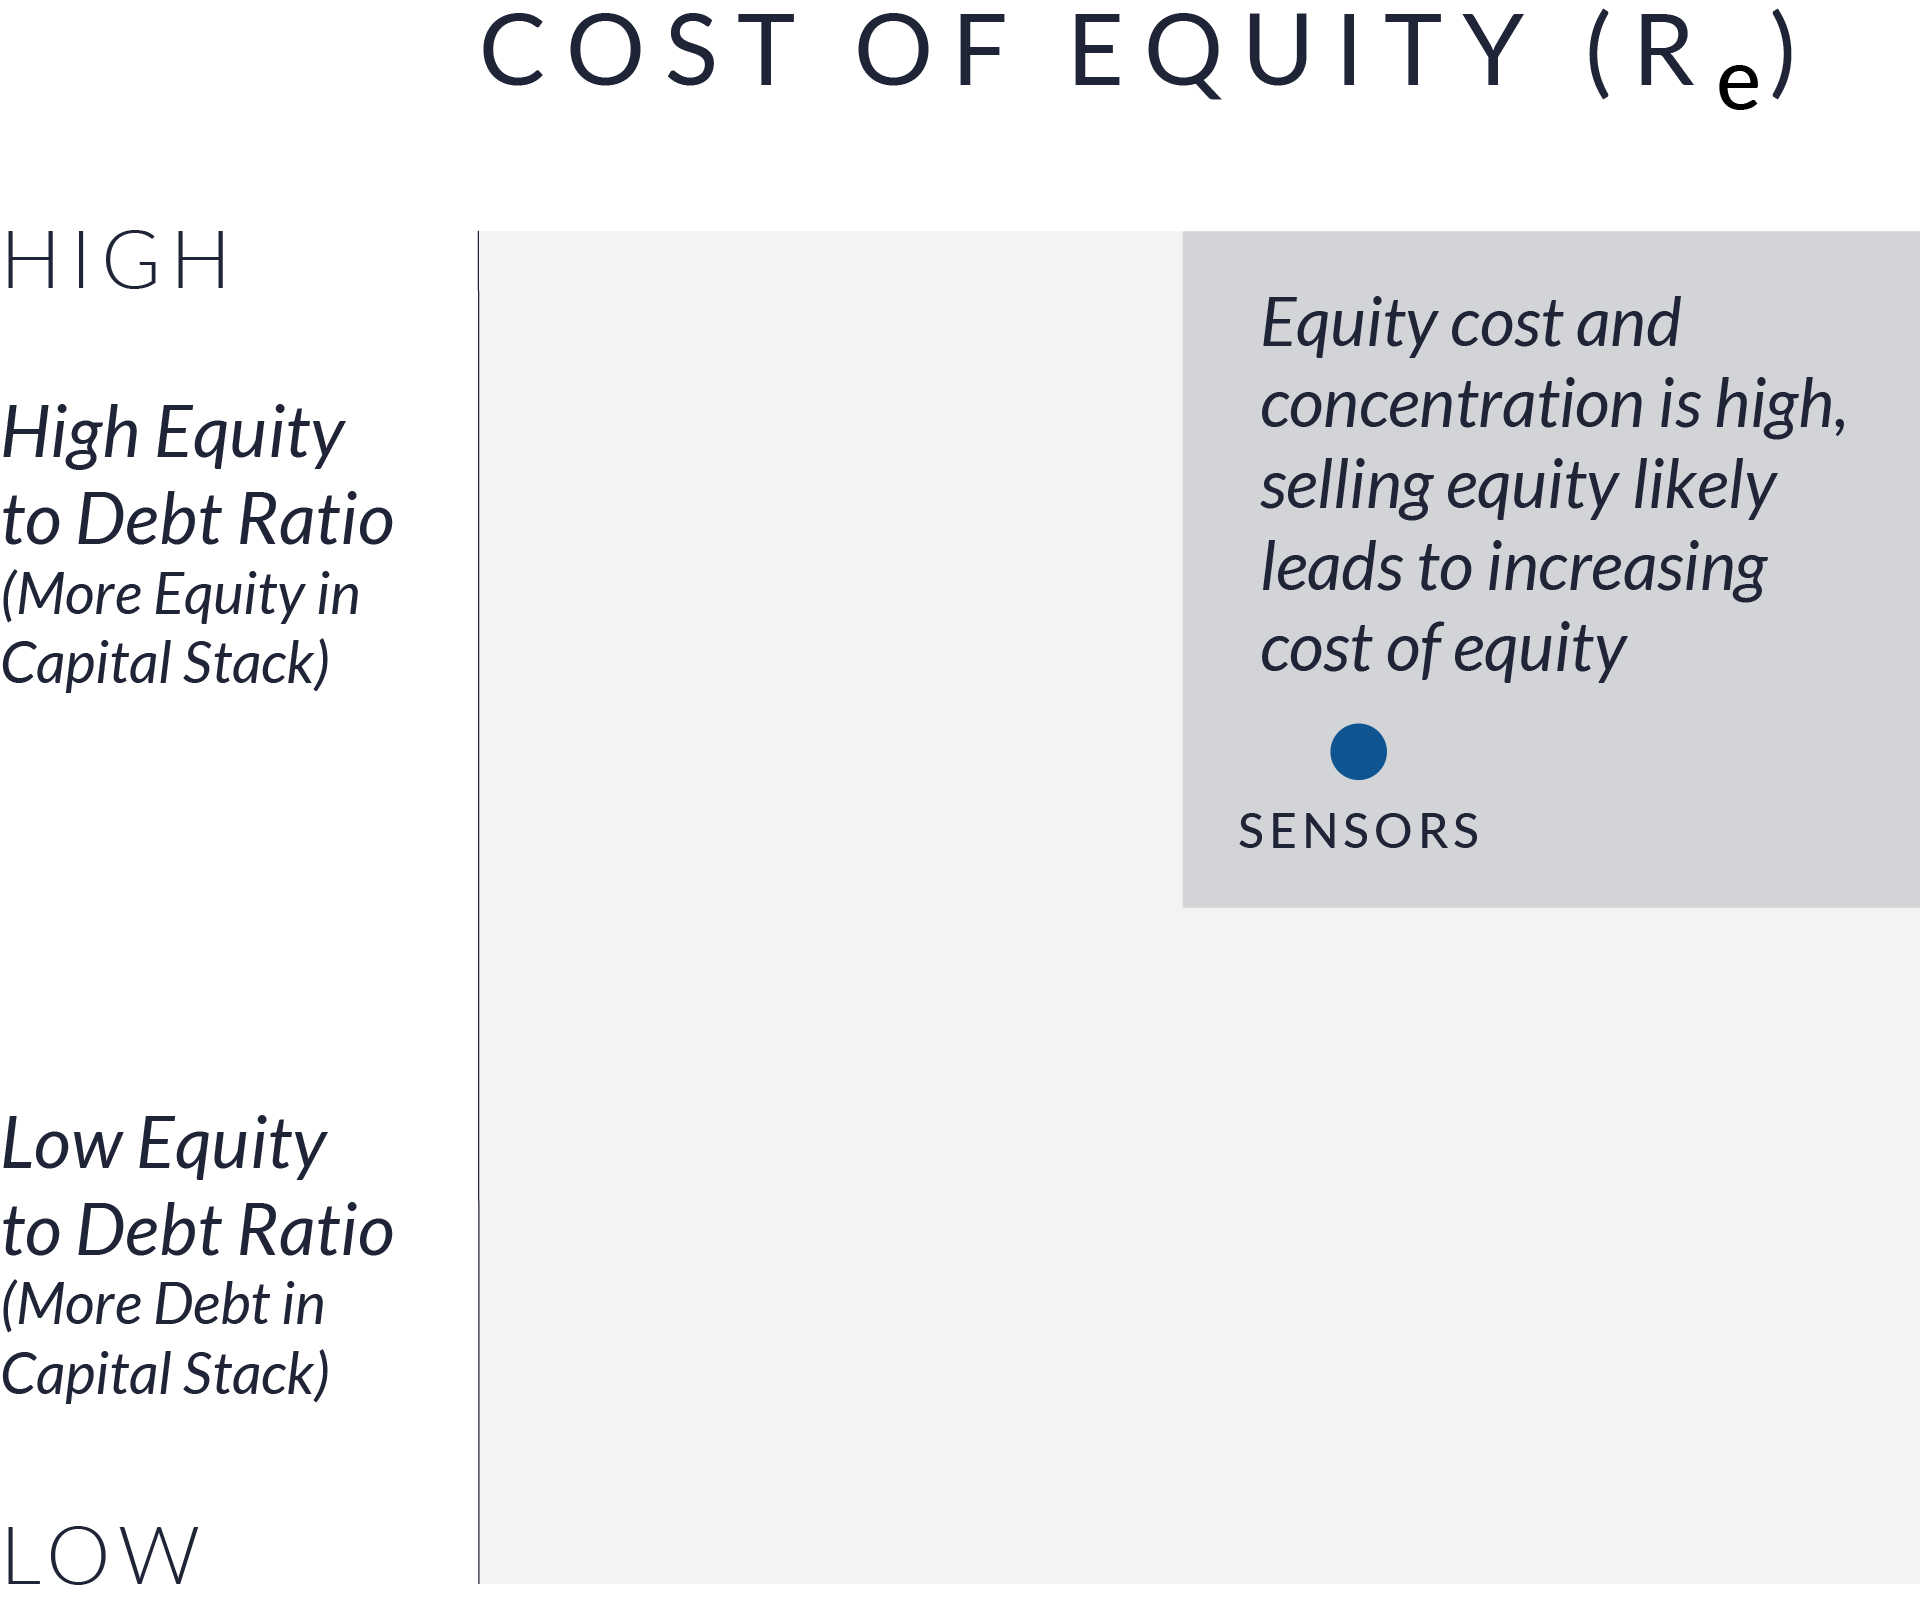
Sensors: Equity and Debt Matrix Implications for M&A
In the equity matrix, sensor companies fall into the quadrant where Re is high while the proportion of equity in the capital structure is moderate. This reflects buyer expectations that, although the sector has attractive long-term applications, companies face competitive markets and varying levels of pricing power. Equity financing is available, but buyers look for strong evidence of differentiation, such as specialized technology, integration capabilities, or stable customer relationships before supporting higher valuations in M&A transactions. Buyers will evaluate targets carefully to ensure that growth opportunities are clear and that market positioning is defensible.
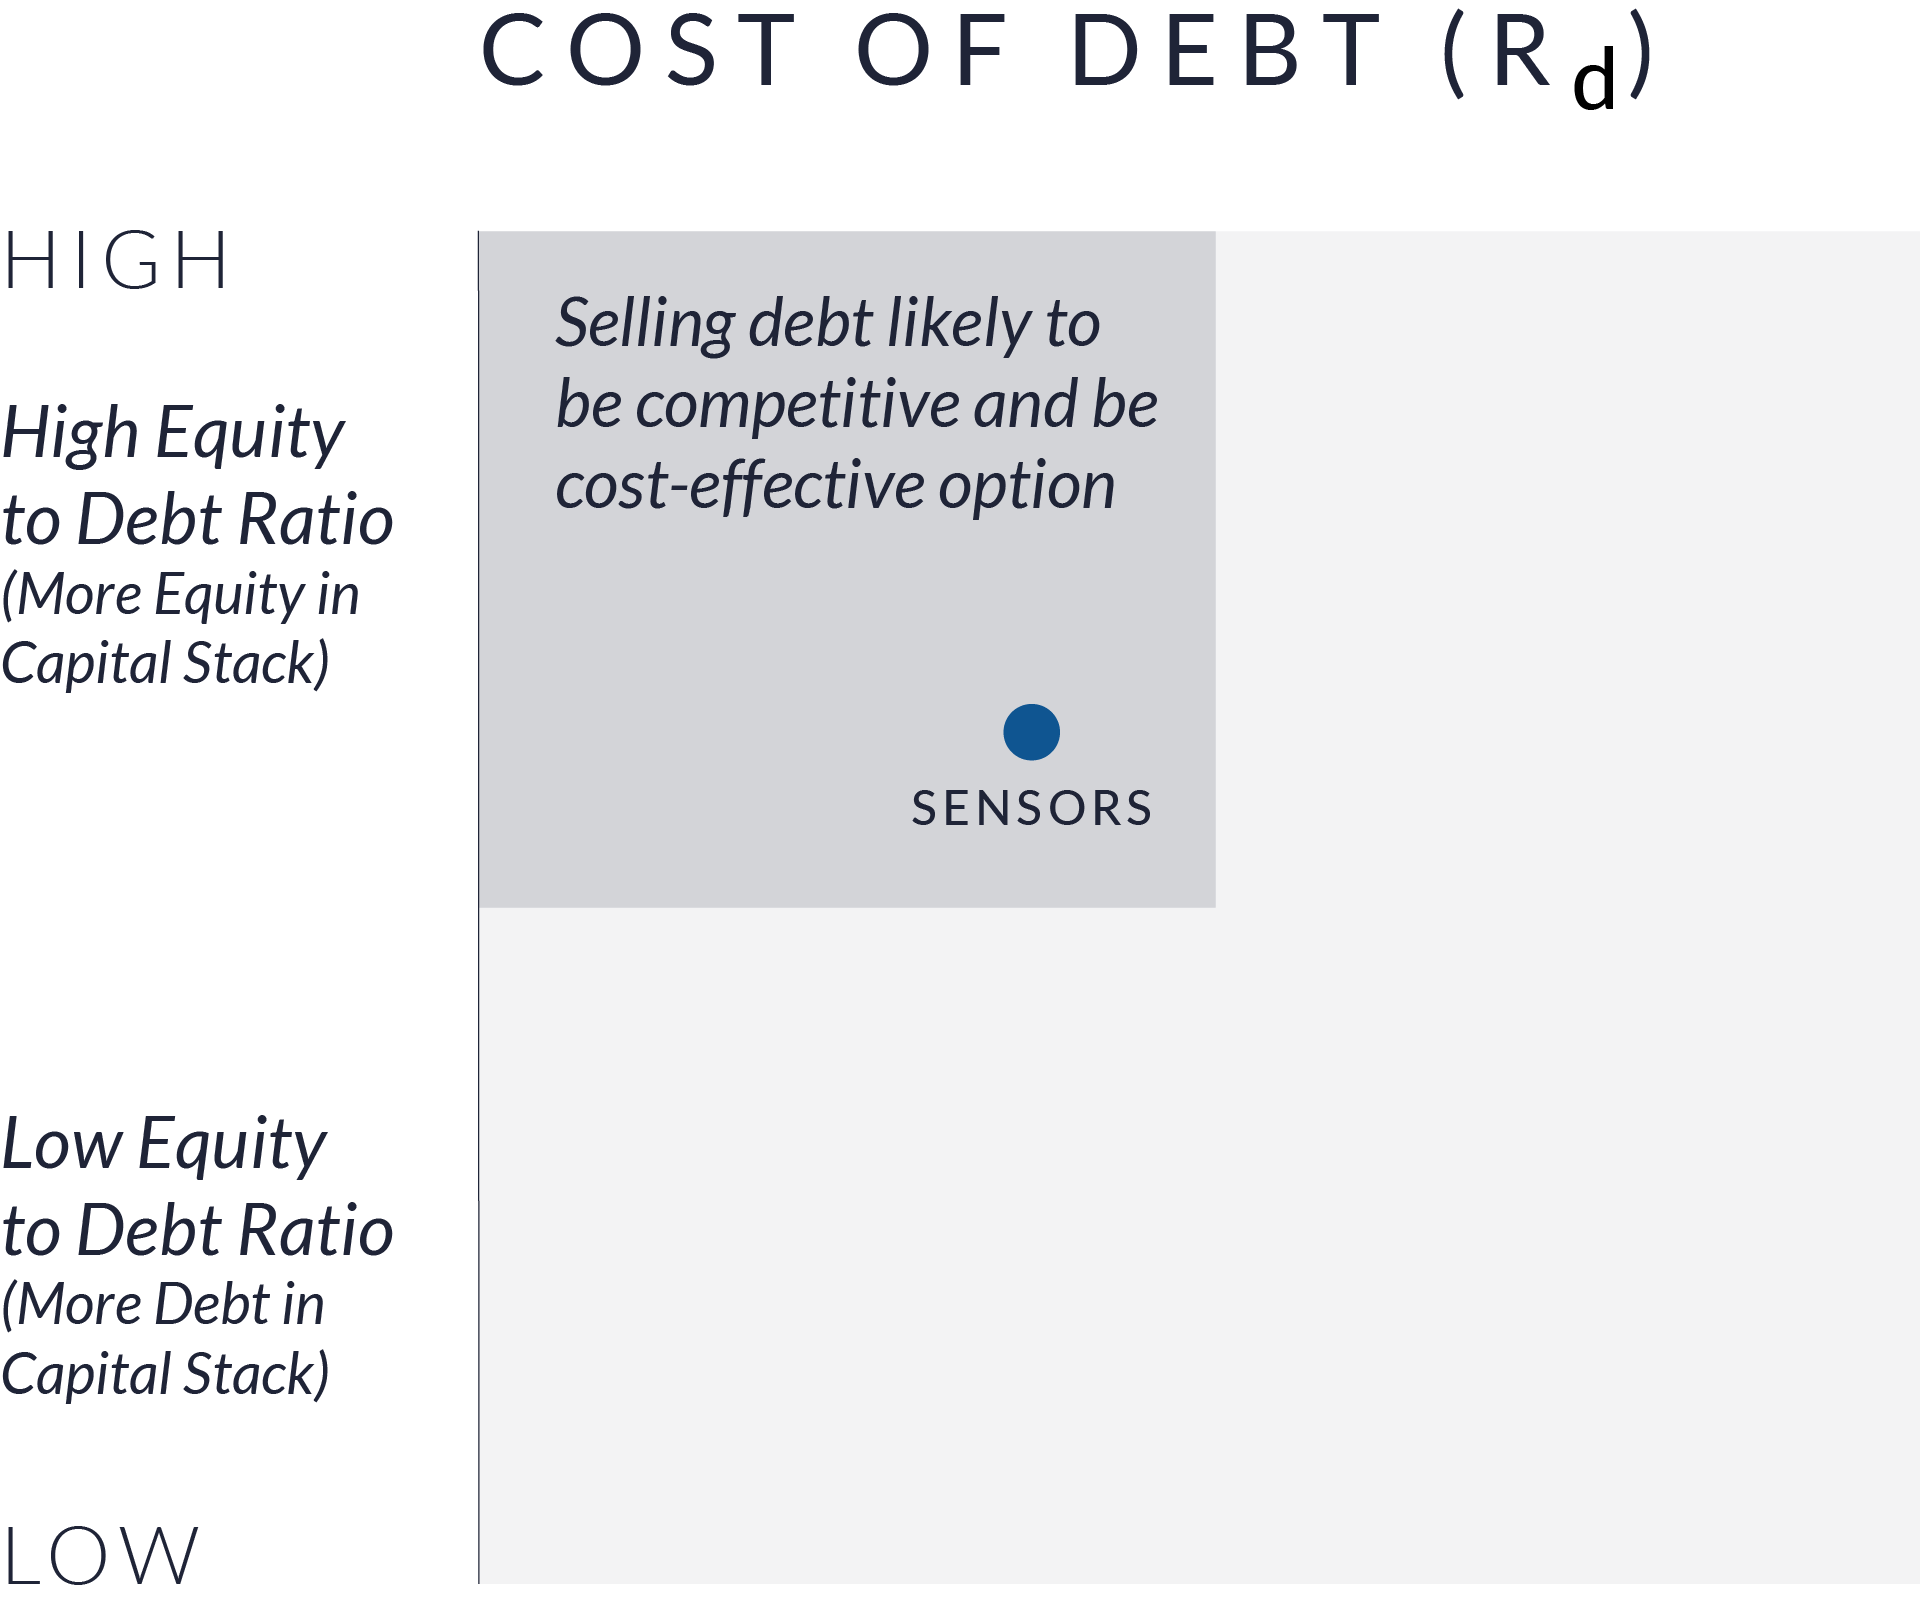
In the debt matrix, sensor companies fall into a position characterized by modest existing debt levels and comparatively favorable borrowing costs. Lenders generally view the sector as stable due to its exposure across diversified end markets such as automotive, industrial, and communications. This creates meaningful capacity for debt financing in acquisitions, allowing buyers to pursue deal structures that balance equity and debt efficiently. While the use of leverage must still be aligned with the company’s cash flow profile, the availability of reasonably priced debt enhances the ability of both strategic buyers and financial sponsors to participate in sensor-focused transactions.
How Do Sensors Compare to Semiconductors and Spectrum in Terms of Capital Structure?
Sensor firms occupy a middle ground between semiconductors and spectrum companies. With 89% equity and 11% debt making up the capital stack, they blend moderate leverage with growth-oriented funding. They have more tangible assets than semiconductors but less than spectrum operators, and they operate in markets that are innovative but fragmented. This creates a moderate-risk, moderate-return profile.
Why Do Sensors Carry a High Cost of Equity?
Despite being less equity financed than semiconductors, sensors face intense competition and limited pricing power. Many sensor products are commoditized components sold with thin margins unless they are bundled with software or services. This dynamic leads to uncertain cash flows and scaling challenges, which increase buyer perspective of risk. As a result, equity buyers demand higher returns, pushing the cost of equity close to 10%, the highest among the three sectors.

Spectrum
Within the IoT and communications ecosystem, spectrum assets are the foundation of data transmission. Mobile carriers, cable operators, and satellite providers depend on licensed spectrum to deliver connectivity across 5G, broadband, and satellite networks. Because these assets generate stable, recurring cash flows backed by long-term licenses, spectrum operators rely more heavily on debt financing compared with other IoT segments.
The spectrum sector includes major integrated carriers such as AT&T, Verizon, and T-Mobile, large cable operators like Comcast and Charter, and satellite providers including Dish, Iridium, and Viasat. These companies differ widely in scale, leverage, and cost of capital.
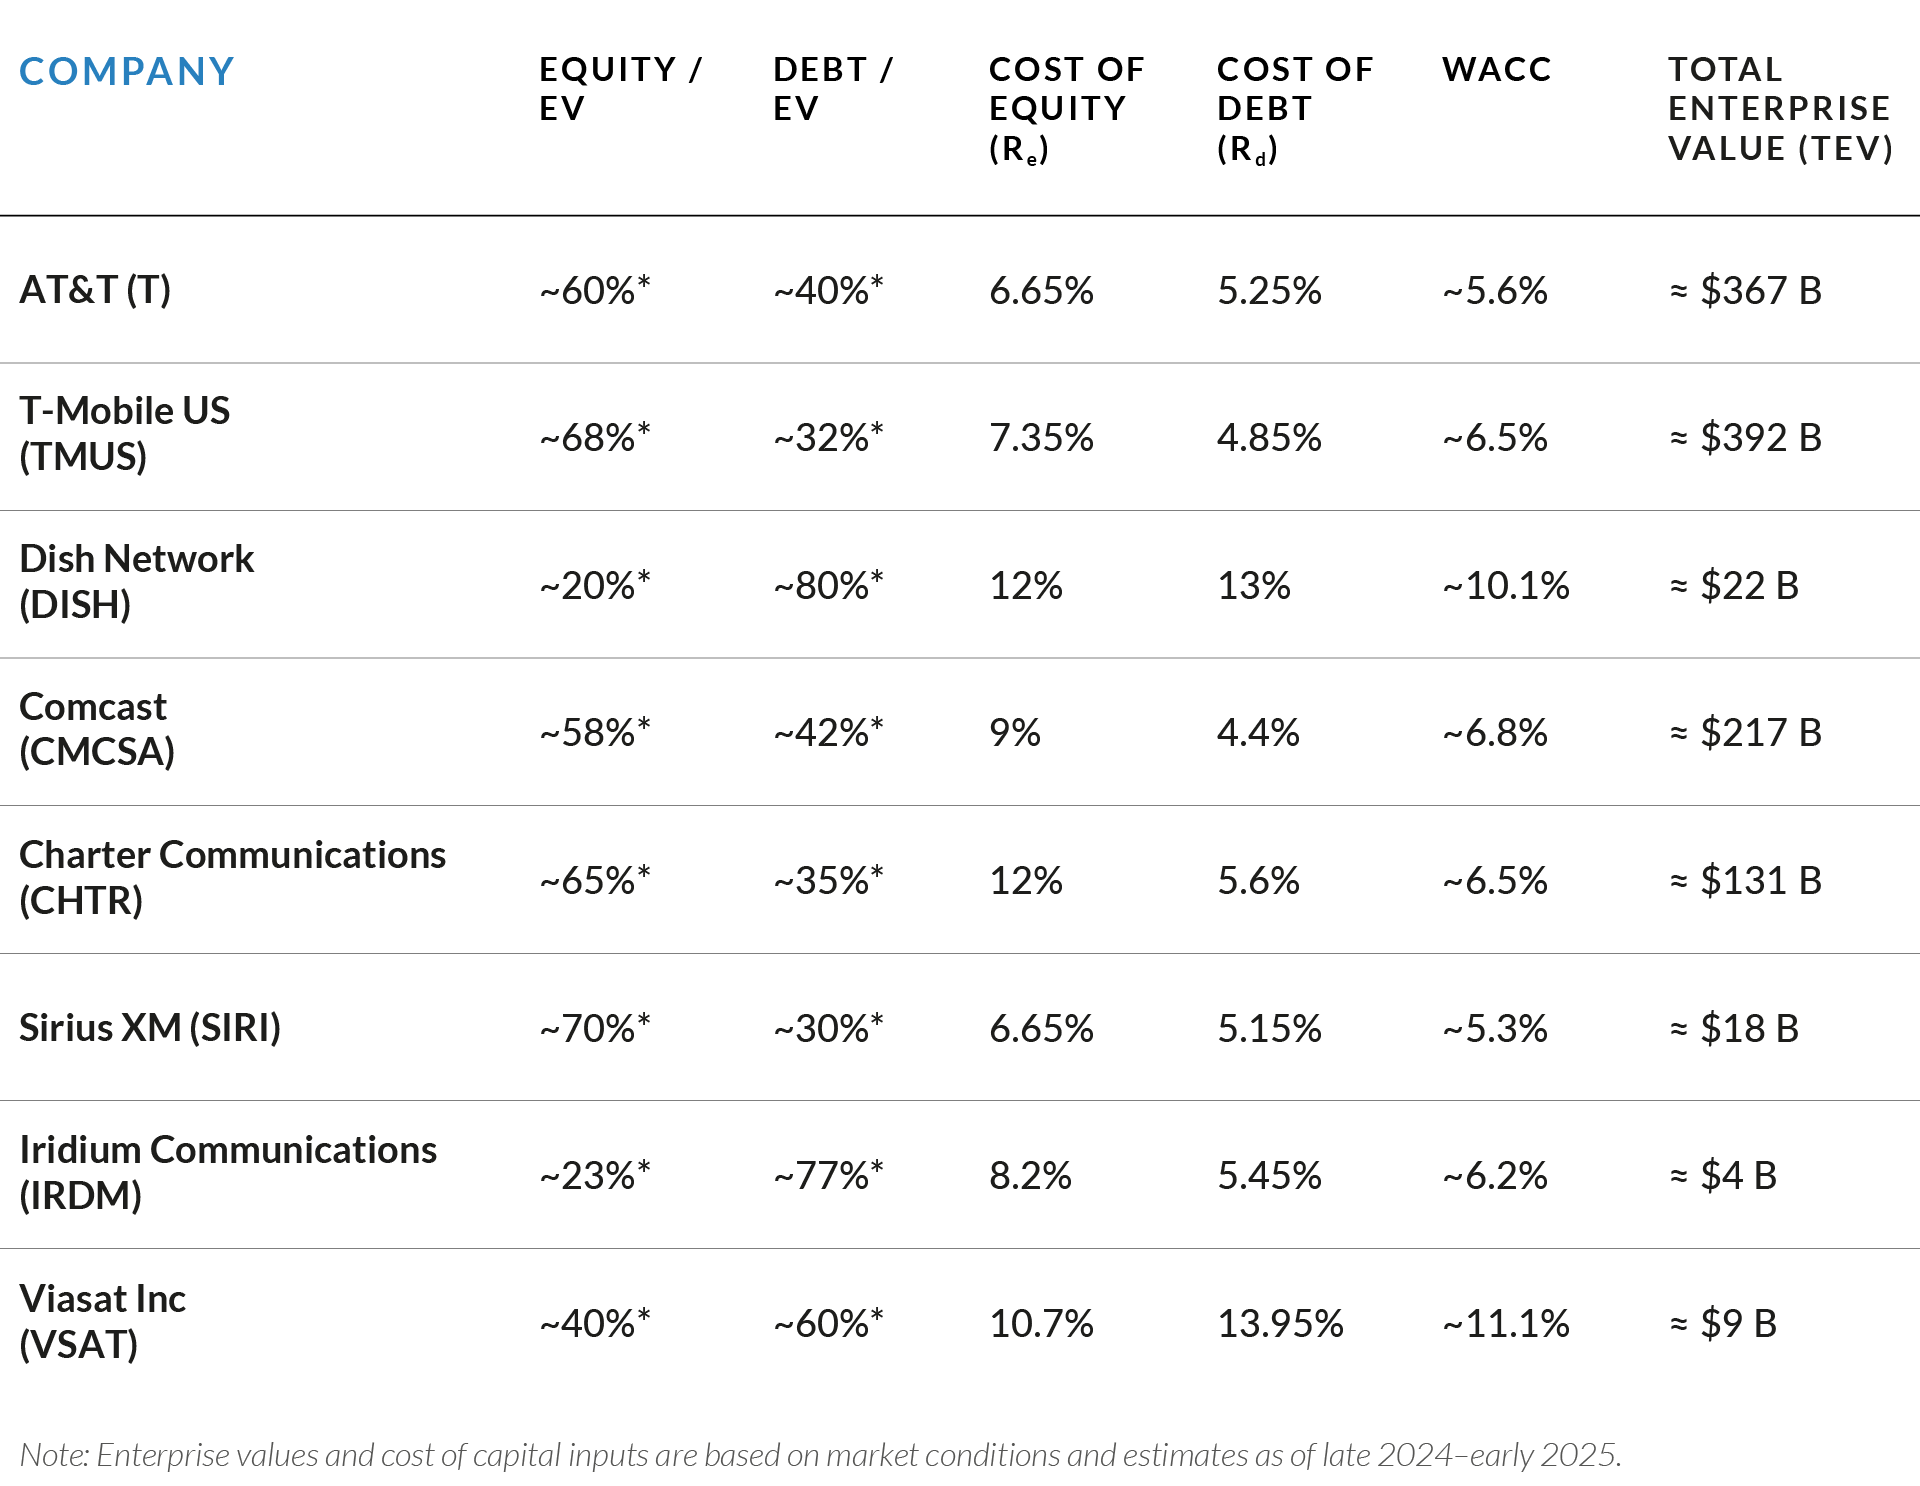
As shown in the figure above, the spectrum peer group maintains an average equity-to-enterprise value ratio of approximately 62% and a debt ratio near 38%. This capital mix is the most balanced among IoT-related sectors. The average cost of equity (Re) stands at around 8.1%, while the average cost of debt (Rd) is roughly 5.2%, resulting in a weighted average cost of capital of about 7.5%.
Large incumbents such as AT&T (TEV ≈ $367B) and T-Mobile (TEV ≈ $392B) benefit from scale and diversified revenue streams, maintaining WACCs in the 5.5%–6.5% range. Mid-sized operators such as Comcast and Charter operate with moderate leverage and WACCs between 6.5% and 8.0%, while smaller or more highly leveraged players like Dish and Viasat face higher WACCs exceeding 10%.
Larger, publicly listed operators also benefit from deep and diversified access to debt markets, including investment-grade bond issuance and committed credit facilities, which lowers borrowing costs and contributes to a reduced cost of capital. Collectively, the spectrum peer group represents a combined enterprise value of over $1.1 trillion. The sector’s higher use of debt financing reflects lenders’ confidence in the long-term cash flow visibility and collateral strength of spectrum assets.
Spectrum: Debt Concentration
Spectrum companies operate with the most balanced capital structures among the three IoT segments. Their businesses are built around regulated, asset-backed infrastructure that generates recurring cash flows over long-time horizons. Because of this stability, spectrum operators use higher levels of debt relative to semiconductors or sensors, without materially increasing financial risk.
On average, the sector funds approximately 62% of enterprise value with equity and about 38% with debt. This mix reflects strong lender confidence in tangible spectrum licenses and predictable service revenues. The average Re is about 8.1%, while the average Rd is roughly 5.2%, resulting in a weighted average cost of capital in the range of 7% to 7.5%, the lowest across the IoT value chain.
The lower WACC of spectrum compared to semiconductors and sensors, illustrates how the market perceives spectrum assets as relatively low risk as it relates to their ability to pay off debt. These are cash-generative, utility-like businesses with limited technological disruption risk. In contrast to semiconductors or sensors, where future returns depend on innovation or demand cycles, spectrum returns are driven by stable user demand and long-term frequency licenses.
Spectrum assets are best evaluated in M&A as cash flow driven infrastructure businesses rather than technology platforms. The predictability of revenues and the strength of licensed assets allow buyers to structure transactions around leverage and refinancing efficiency, making balance sheet optimization a primary source of value creation. Successful acquirers are those that can deploy low-cost debt responsibly, maintain regulatory compliance, and preserve cash flow coverage post-closing. While this structure supports attractive valuations, execution risk increases quickly for buyers with constrained financing flexibility or elevated leverage at entry.
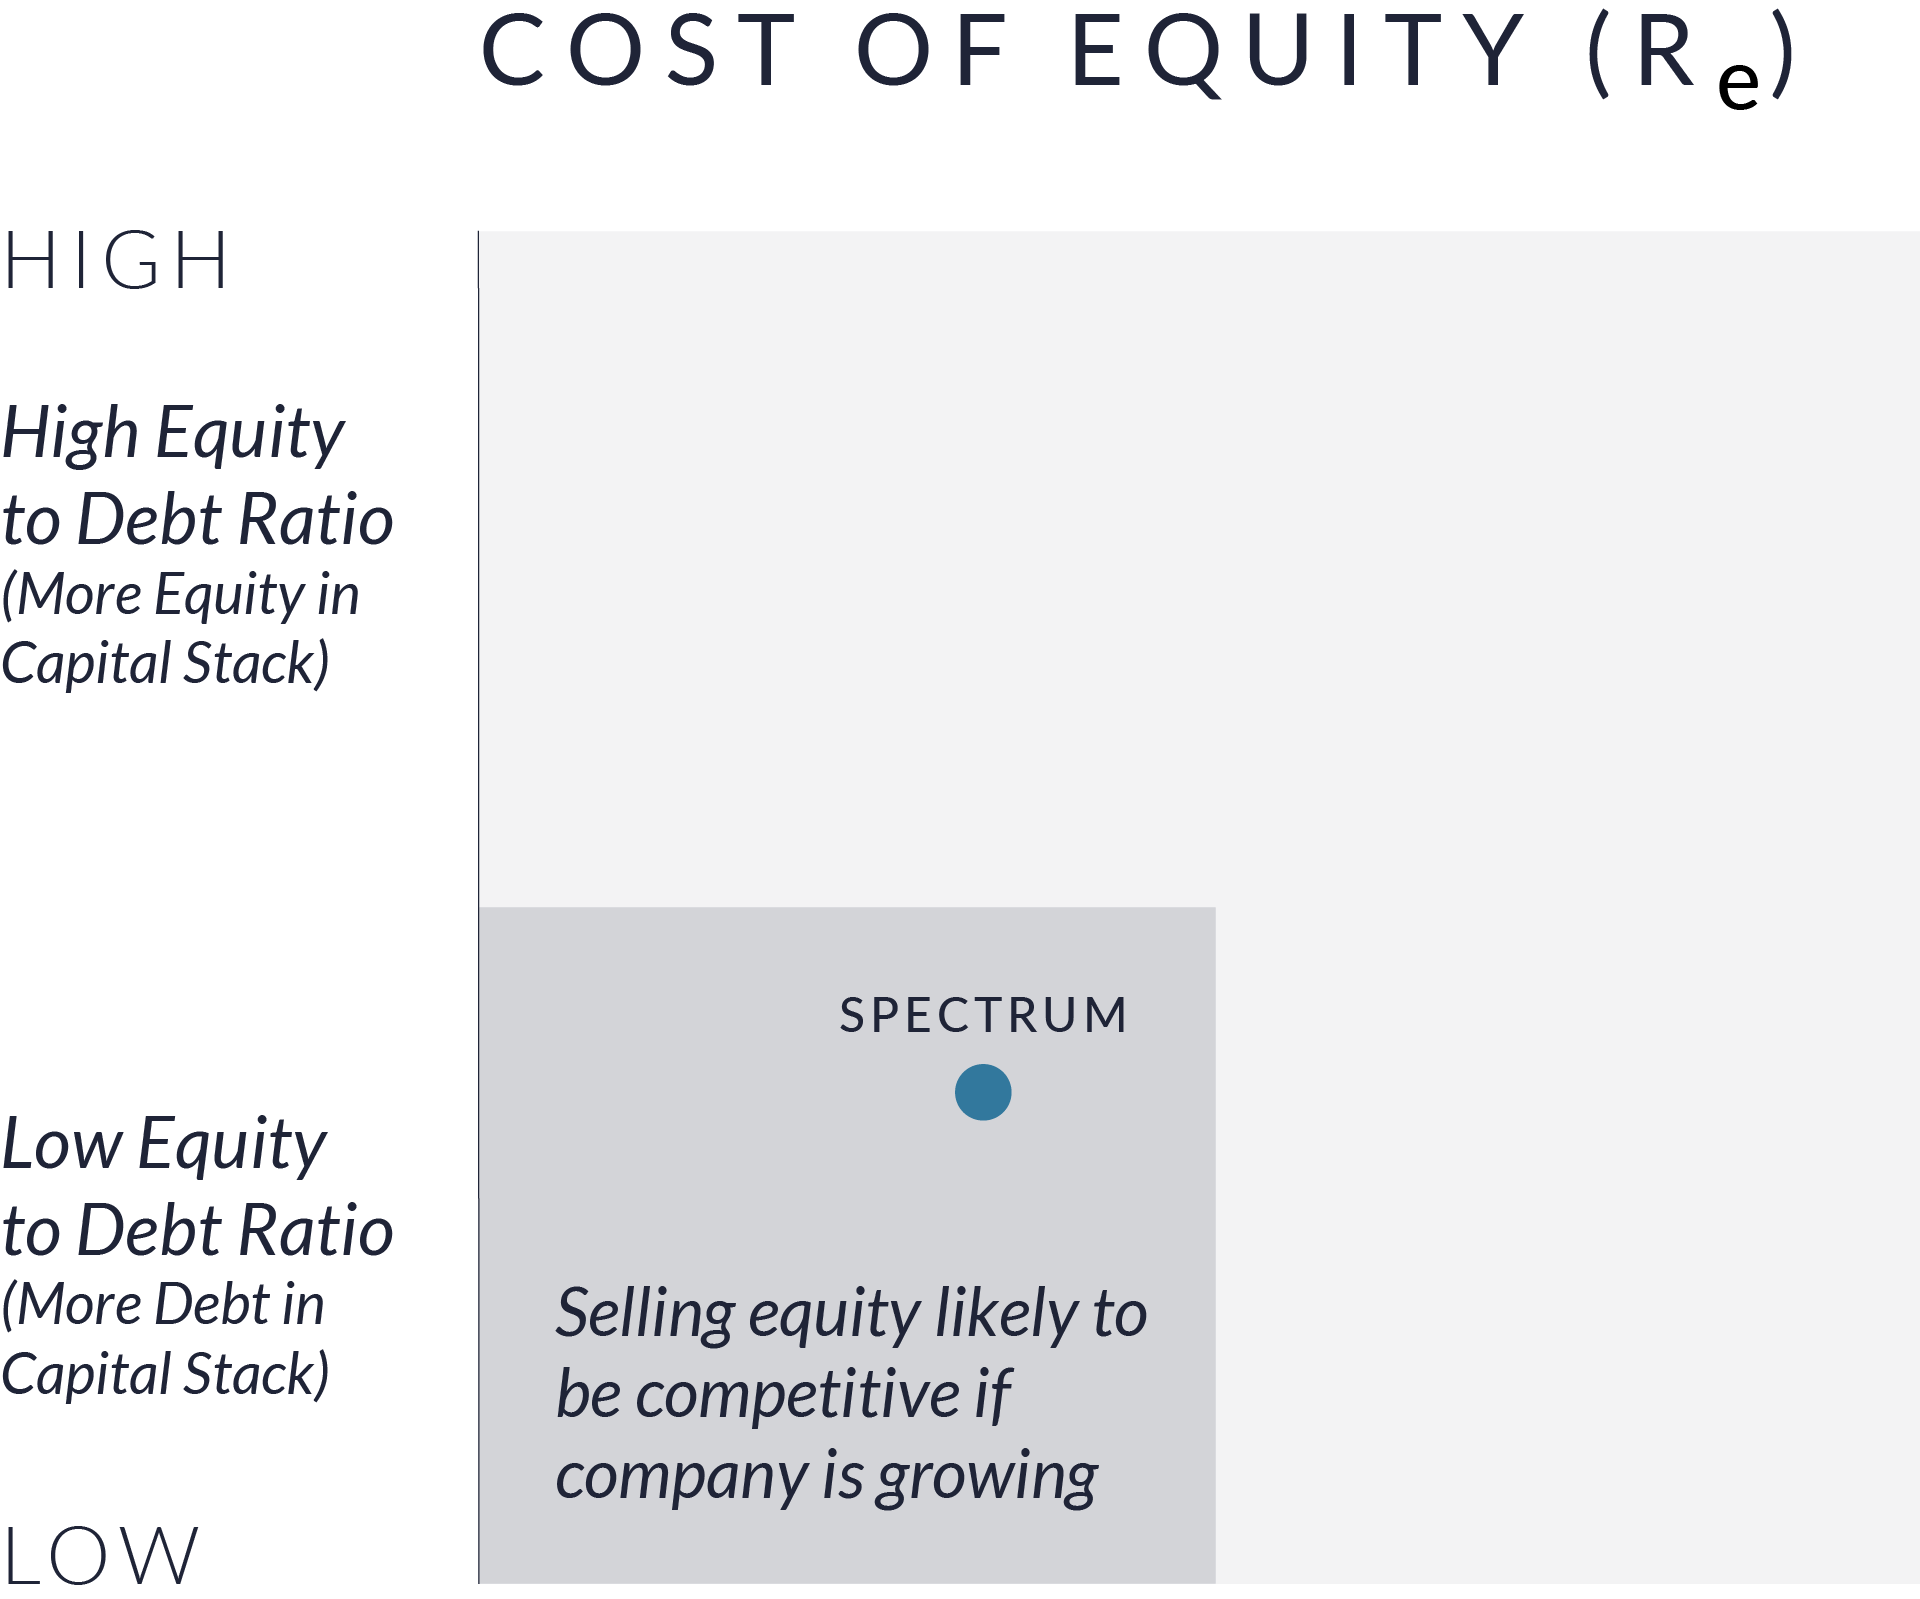
Spectrum: Equity and Debt Matrix Implications for M&A
In the equity matrix, spectrum companies fall into the quadrant where Re is relatively low and the share of equity in the capital structure is moderate. Since these companies are stable, equity plays a constructive role in financing, especially when companies are pursuing growth initiatives or seeking to enhance network capacity. In M&A, this positioning often supports valuation approaches that emphasize long-term cash flow visibility and infrastructure-like characteristics.
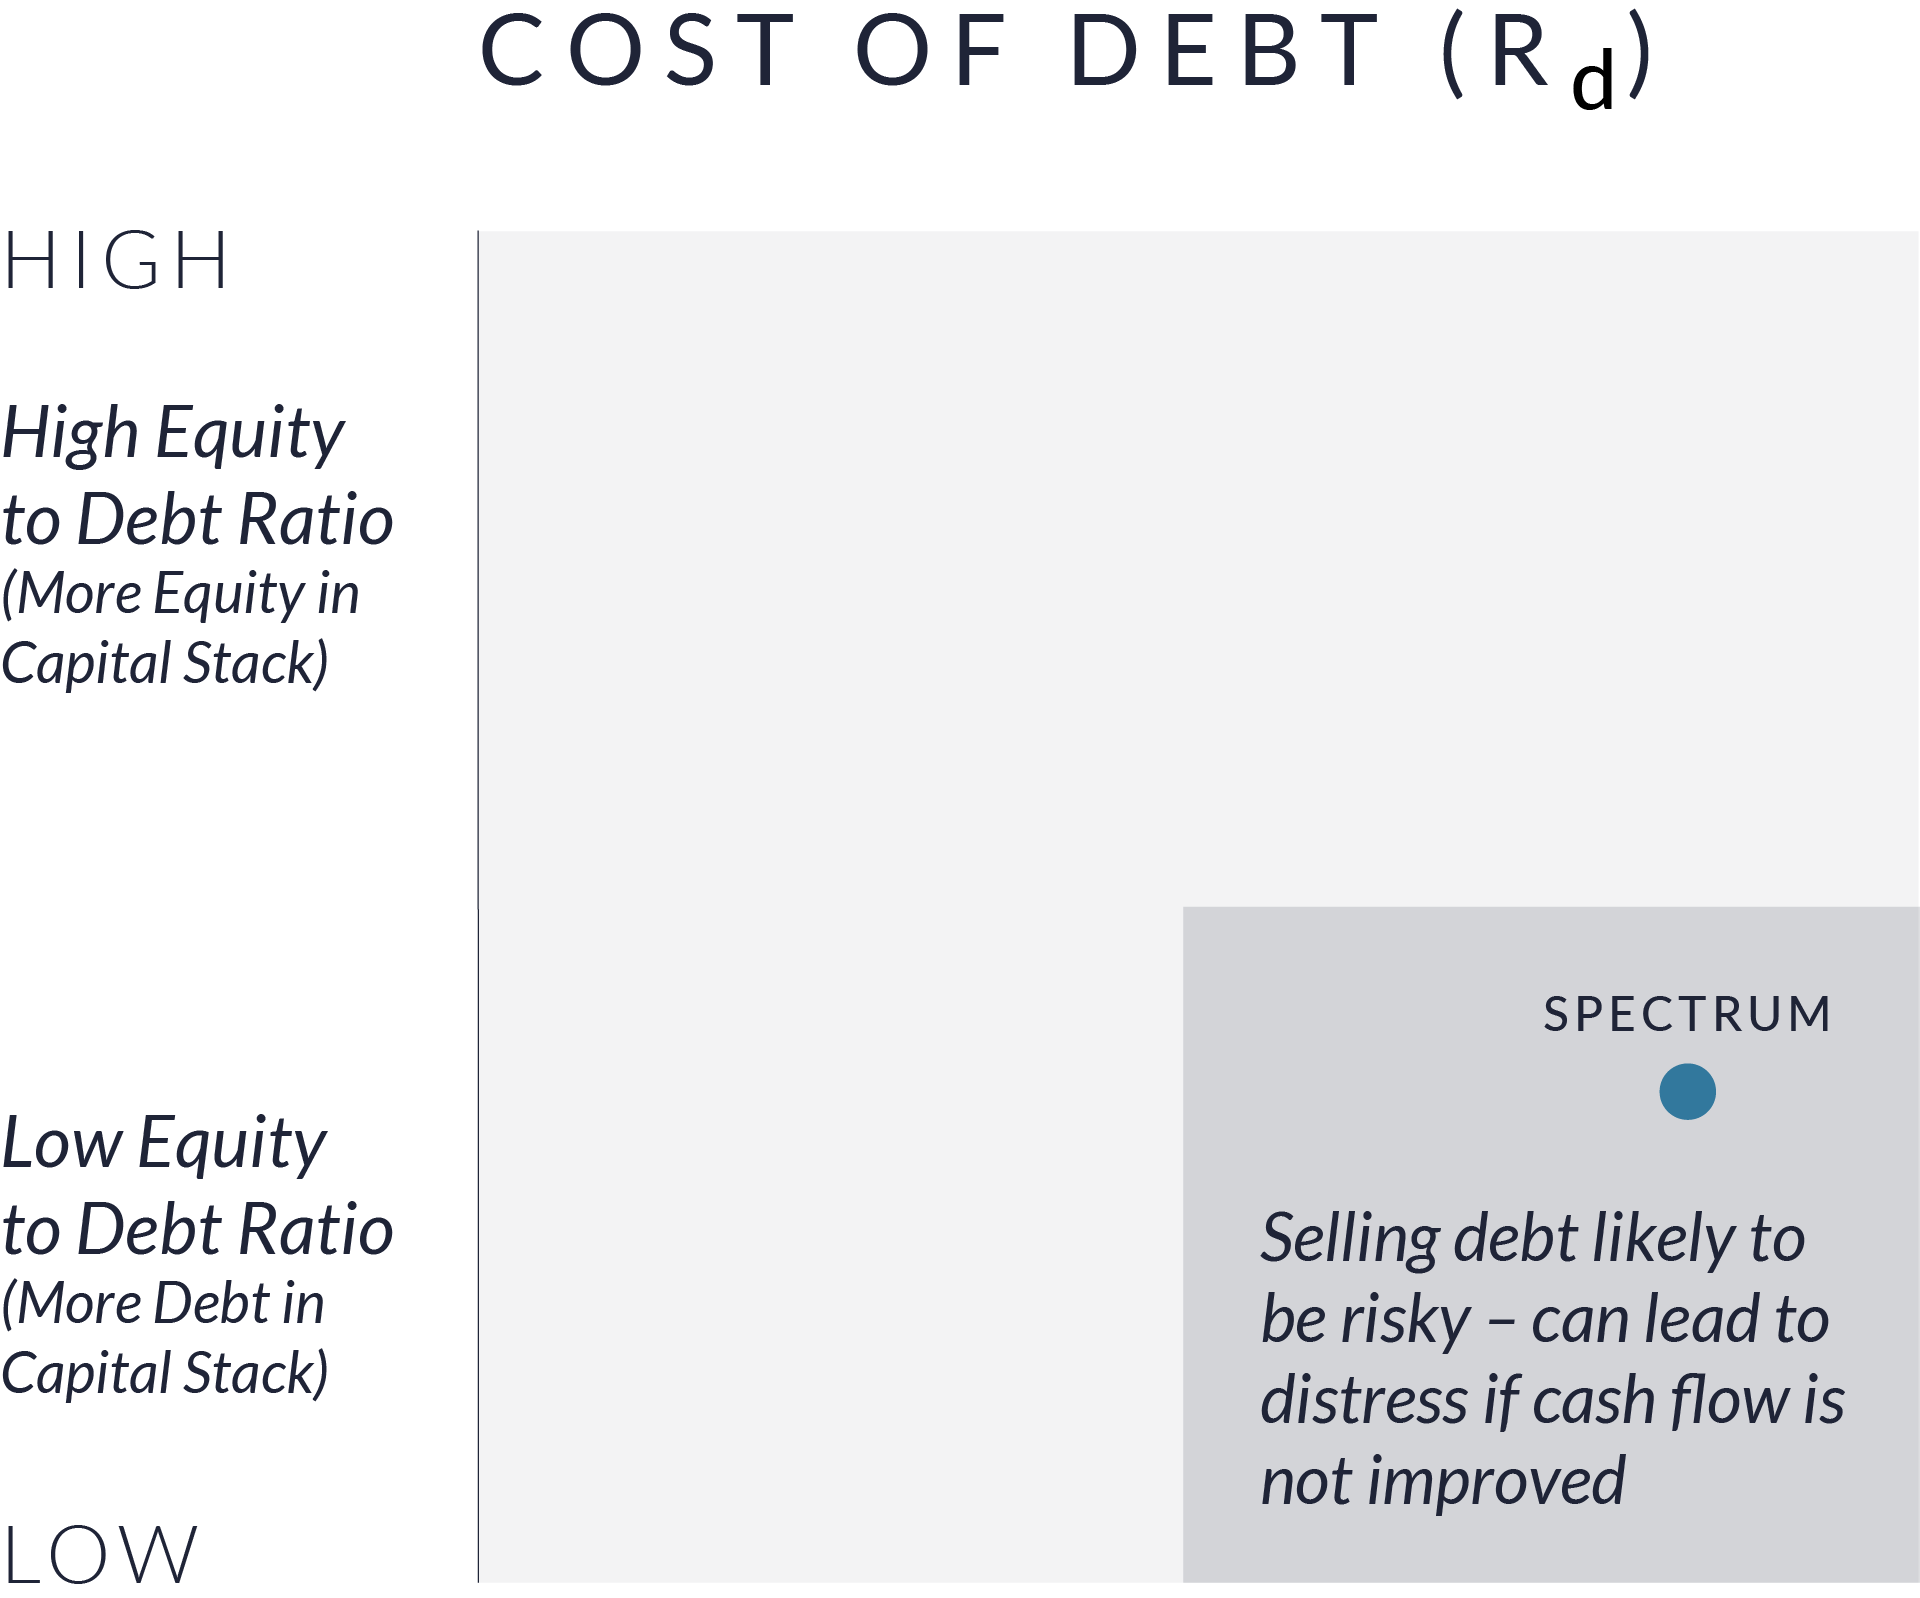
In the debt matrix, spectrum companies occupy the position where debt usage is high while borrowing costs remain relatively attractive. Lenders are comfortable providing financing because the industry is supported by tangible licensed assets and consistent revenue streams. As a result, many companies in the spectrum segment rely on debt as the primary component of their capital structure. In the M&A context, this enables acquirers to fund transactions efficiently through leverage, provided cash flow remains steady and regulatory conditions are supportive. The combination of strong debt capacity and stable fundamentals helps sustain healthy valuation levels and supports buyers’ ability to finance both acquisitions and ongoing investment needs.
Why Do Spectrum Companies Have the Highest Debt Concentration?
Spectrum operators rely on physical, regulated assets such as frequency licenses and infrastructure, which produce stable, recurring revenues. These characteristics make them ideal for debt financing, allowing lenders to provide favorable terms secured by tangible collateral.
Why Does the Spectrum Sector Have the Lowest Cost of Debt in the IoT Stack?
Spectrum assets meet all the criteria lenders prefer: tangible, regulated, and revenue-generating with long-term licenses. They provide predictable cash flows and have high barriers to entry. Because of this, lenders perceive them as creditworthy, enabling spectrum operators to secure financing at relatively low rates.
Wacc As A Strategic Lens For Iot M&A
Conclusion
WACC is a Lens M&A Buyers Use to Measure Future ReturnsWACC is a lens through which buyers can assess risk, financing flexibility, and value creation potential in IoT M&A. Across semiconductors, sensors, and spectrum, differences in cost of equity, cost of debt, and capital structure reflect fundamentally different business models, risk profiles, and growth trajectories. Understanding these differences is essential to determining what a business is worth at close and how it can be financed, operated, and scaled over time.
Capital structure matters as much as headline valuation metrics. Semiconductor businesses command higher equity weightings and higher WACC because buyers are underwriting long-term innovation and technological leadership. Sensor companies occupy a middle ground, where operational execution and selective leverage drive returns. Spectrum assets, by contrast, behave more like infrastructure, supporting higher debt levels and lower WACC due to stable, asset-backed cash flows.
For acquirers, WACC provides a framework for disciplined decision-making. It helps determine how much leverage a target can support, whether a buyer’s cost of capital creates a structural advantage, and where value can be unlocked through post-closing capital optimization rather than multiple expansion alone. Buyers that understand how WACC evolves with scale, maturity, and integration are better positioned to pay appropriate premiums, structure sustainable financing, and invest confidently after closing.
Ultimately, successful IoT M&A depends on aligning valuation, financing, and strategy. By treating WACC as a forward-looking measure of risk and return rather than a static input, acquirers can differentiate between businesses that merely look attractive at entry and those that can generate durable value over the long term.