Industrial Internet of Things (IIoT) M&A Transaction Drivers

Mergers and acquisitions (M&A) transactions within the Industrial Internet of Things (IIoT) carry specific requirements that sellers, buyers, and advisors must carefully consider when going through the M&A process. This report identifies four key valuation and transaction success drivers in IIoT M&A transactions as tangible or intangible assets.
Tangible drivers include income statement and balance sheet adjustments as well as working capital calculations. Intangible drivers include supply chain risks and customer contracts, such as pricing models, contract durations, average order quantities, and other contractual arrangements with the IIoT companies’ end customers. Correctly identifying and measuring these factors materially impacts valuation and the likelihood of closing a transaction.

Defining the Scope of IIoT Businesses
Industrial Internet of Things (IIoT) companies use physical devices, connect them to the internet, and then provide some enhanced functionality to a customer. This functionality includes but is not limited to automation, remote monitoring, and predictive maintenance. IIoT devices include equipment, machines, sensors, monitors, and devices to collect, analyze, and share data in industrial settings. These devices can be used in logistics, manufacturing, healthcare, oil and gas, and transportation industries.
IIoT businesses operate under diverse business models. Some IIoT firms sell a comprehensive solution, referred to as Platform as a Service (PaaS). PaaS providers offer infrastructure and tools for device connectivity, data storage, real-time analytics, and integration with other enterprise systems. They allow businesses to create custom IIoT applications tailored to their specific industrial needs without having to build and manage the underlying infrastructure. In return, customers pay based on usage or the number of devices connected to the platform.
Other IIoT firms engage in hardware sales with software and service contracts included in the pricing to maintain the device. Either the PaaS model or the hardware sales model may monetize the data they collect by selling it to other businesses that benefit from the information. And finally, IIoT firms may operate on a software-only model, where they license their technology directly to other OEMs or customers who own the devices themselves.
The business models of IIoT firms are diverse, but they all rely on hardware to provide their core value to customers.

Tangible Drivers
Tangible drivers for IIoT transactions impact how firms manage the costs of their devices across the value chain. Most IIoT companies do not manufacture their own devices; instead, they resell them with value-added software and ongoing services. As such, the treatment of each IIoT device—from its purchase by the manufacturer to its sale to the end customer— results in various accounting entries affecting both the income statement and balance sheet.
Income Statement and Balance Adjustments

To analyze the impact of account methods on investment transactions, let us consider two options for recording the value of an IIoT device through its lifecycle from OEM acquisition to ultimate sales to the customer. Sometime IIoT firms account for the initial acquisition of an IIoT device from a manufacturer (such as GE or Siemens) as a balance sheet accounting entry. Cash is used to purchase the device, reducing the cash balance on the balance sheet while increasing current assets. Once the device is acquired, software engineers and hardware engineers modify the physical device to enhance its capabilities. This investment of time has associated labor costs and sometimes associated physical product costs. In this example, we will refer to this as Option A. Alternatively, the IIoT firm’s expenditure on enhancing the device may result in these costs being recorded in the income statement as expenses, which we will refer to as Option B.
If a company elects to record these value-added enhancements on their income statement only, they are simply overreporting expenses on the income statement and underreporting the cost of goods sold (COGS) when the device is ultimately sold to the end customer (Option B). If companies account for value-added enhancements by increasing the value of the inventory on the balance sheet, they must also increase the COGS by the same amount when the device is sold and generates revenue on the income statement (Option A). When the device is sold to the end customer, this COGS is deducted from the product’s revenue, thereby reducing net income, which reduces equity by an equivalent amount through retained earnings on the balance sheet.
Consider the following: A device is acquired for $100. A firm invests $20 in value-added enhancements.
Option A
If the firm chooses to add all the value-added enhancements to inventory, the additional $20 of expenses is listed as a current asset on the balance sheet. Cash is reduced by $20 and inventory increases by $20. It does not impact the income statement. When the device is later sold, the COGS is $120, not $100. This allows the ultimate expenses to appear on the income statement at the time of the device sale. Assume each device sells for $180.
Therefore, the income statement records revenue of $180, and COGS of $120, so $60 is the gross profit.

Option B
Compare this example to one in which a company did not account for these improvements on the balance sheet. The device is sold for $180; COGS is $100, therefore $80 is available for the gross profit. This does not include the $20 paid for services and materials. That was already recorded previously as an expense in the income statement.

The impact for business owners is two-fold:
- Different accounting treatments for COGS have material impacts on cash flow.
- The choice of how to account for value-added enhancements may have a material impact on an IIoT firm’s working capital.
At first glance, this appears to be a mundane accounting example. But a closer look indicates how it can affect an M&A transaction.
Choosing Option B over Option A is more common because it’s simpler and more akin to cash accounting, which is commonly used by small and medium-sized businesses. However, Option B will suppress the cash flow of a business while the device is being modified and improved, which can sometimes take several months. If a firm chooses Option B, it will result in a lower cash flow number, and then make the money back in its reported gross margin when the device is sold to a customer later.
The key element of this analysis is time. In Option B, the firm is showing expenses before the revenue from those expenses appear. And it is showing these expenses in a scale multiplied by the number of devices it sells, which can be in the thousands. At scale, these impacts on the cash flow reporting of the business can become material and directly impact EBITDA, which is the most common metric buyers use to determine valuations for private equity companies. As long as the time to make value added enhancements is longer than one reporting period (usually one month), then this over-reporting of expenses will occur.

In this example ignoring the value-added enhancements allowed the firm to increase its gross margin by 11%, which would seem desirable, but reduced EBITDA by 50%. This in turn reduced the total enterprise value of the company by 50%. This is a highly material change for a firm that is operating identically in both options A and B, but reporting financials differently. Said differently, constantly expensing every single cash item on an income statement will naturally suppress EBITDA, and companies should avoid accounting for expenses that suppress EBITDA when they can. IIoT firms have a unique opportunity to do this.
Working Capital Calculations
In many purchase agreements, it’s specified that 30 to 90 days after closing there’s an “adjustment” of working capital. This means either party may transfer funds to the other to compensate for any excess or deficiency in the working capital present in the business on the closing day.

Working capital is calculated by deducting current liabilities from current assets. A working capital mismatch happens when the difference between assets and liabilities is greater than expected. In Option B above, we indicated how underreporting assets can suppress EBITDA and lower the enterprise value of a transaction. If a seller performs the accounting laid out in Option B, there is a risk they would have to return a portion of their cash on close proceeds to the buyer 90 days after close. This can become material based on the structure of the deal. Learn more about transaction structures.
Continuing with our examples above, there are two options. One is where the company undergoes a change of control transaction for $400 and the other is where the company sells for $200. In Option A, the seller increased their current assets while value-added enhancements were being added to the IIoT device. Option B did not account for this increase in assets. So Option A will result in a higher working capital calculation than Option B.
It’s already indicated in this report that Option B can lead to a 50% reduction in TEV to the seller. In addition, Option B also underreports working capital. If a company sells for $200 and 50% of that TEV is provided in cash at closing, the selling shareholders receive $100. If the seller has inadvertently underreported working capital by $20, the buyer will request that $20 as a “adjustment” 30 to 90 days after closing. This means the seller will be at risk of losing 20% of their cash on close due to inaccurate balance sheet accounting.
There are unique complexities to balance sheet accounting for IIoT devices. This same level of complexity does not exist in IT services, professional services, e-commerce, and many other business models. This is mostly due to the assembly line-type process where IIoT devices act as manufacturers of intangible assets on top of physical goods.
In many private companies, especially smaller ones, the working capital figures may not be updated regularly or accurately. This can lead to differences between reported and actual figures, impacting the perceived financial health of the business during acquisition negotiations.


Intangible Drivers
Supply Chain Risks
During an IIoT M&A transaction, changes in ownership or strategic direction can disrupt existing supplier relationships. Onboarding new suppliers could lead to delays in procurement, increased costs, or quality issues. Integrating two companies’ supply chains involves aligning procurement processes, inventory management systems, and logistics networks.
Cybersecurity vulnerabilities are also a threat, as IIoT systems are susceptible to data breaches and ransomware attacks during integration if security measures are not robustly implemented. Buyers seek to understand the volatility in a seller’s supply chain. The more steps a seller can take to reduce its supply chain volatility, the less of a negative impact it will have on an M&A transaction.
Customer Contract Terms and Relationships
Contractual customer relationships are unique in the IIoT business. The basic IIoT firm and customer transaction involves customers paying for hardware, software, services, and support, resulting in complex dynamics that might include multiple purchases. Due to this intricate relationship, there are clear indicators that highlight which contractual relationships create the most value in an M&A transaction.
IIoT Firm – Revenue Models
The initial transaction between an IIoT firm and its customer is the identification and procurement of the hardware device. Whether this device is manufactured in house by the IIoT firm or sourced from another provider, the baseline of costs between the IIoT firm and the customer is defined in this purchase. IIoT devices are complex, and any standard scope of work typically requires numerous IIoT devices. IIoT firm and customer payment models for the hardware devices fall into one of two categories: the complete sale or acquisition of the IIoT device and the leasing or renting of the device.
In the complete sale of an IIoT device, the IIoT firm sells the device to its customer at the cost to make or acquire, plus a profit margin. The customer bears the entire cost of the device. This results in firms receiving an immediate return on investment (ROI) upon selling the device, but does not generate recurring revenue.
In the leasing, renting, or lending device model, the IIoT firm maintains ownership of the device on its balance sheet, and charges the customer regular payments, often with interest or a markup. The greatest challenge for the IIoT firm in this example is the delayed recovery of initial device costs. It often takes years for the IIoT firm to fully recoup the costs of the asset, and even longer to make a profit from leasing, renting, or lending the device. As a result, this creates a much higher financial liability for the IIoT firm in the near term, but better unit economics overall, once it reaches a critical mass of devices generating sufficient recurring revenue to fund its growth.

Leasing, renting, or lending devices is more valuable than selling them. Multiples on recurring revenue consistently drive greater returns for firms in M&A transactions. However, leasing, renting, or lending the devices alone is insufficient to command greater value. Attention should also be given to the minimum order quantities and contract durations associated with either model.
Selling devices can still create value. Many firms lack the necessary credit or equity capital needed to lease a significant amount of devices to customers. Selling devices also generate revenue from implementation, maintenance, support, and services. These ancillary services are sometimes included in the leasing price and sometimes sold separately.
Average Order Quantities and Contract Length
Valuations of recurring revenue are measured over years in IIoT M&A transactions. Therefore, if a contract with a customer is leased and annual, it does not carry a premium compared to selling the device outright. Contracts must exceed one year to carry a premium in valuation. The value of a contract increases significantly from two to 10 years, as indicated in the graph below. IIoT firms benefit from structuring contracts with customers as long as possible but should avoid negotiating terms exceeding 10 years, as they diminish in value compared to two to 10 years.
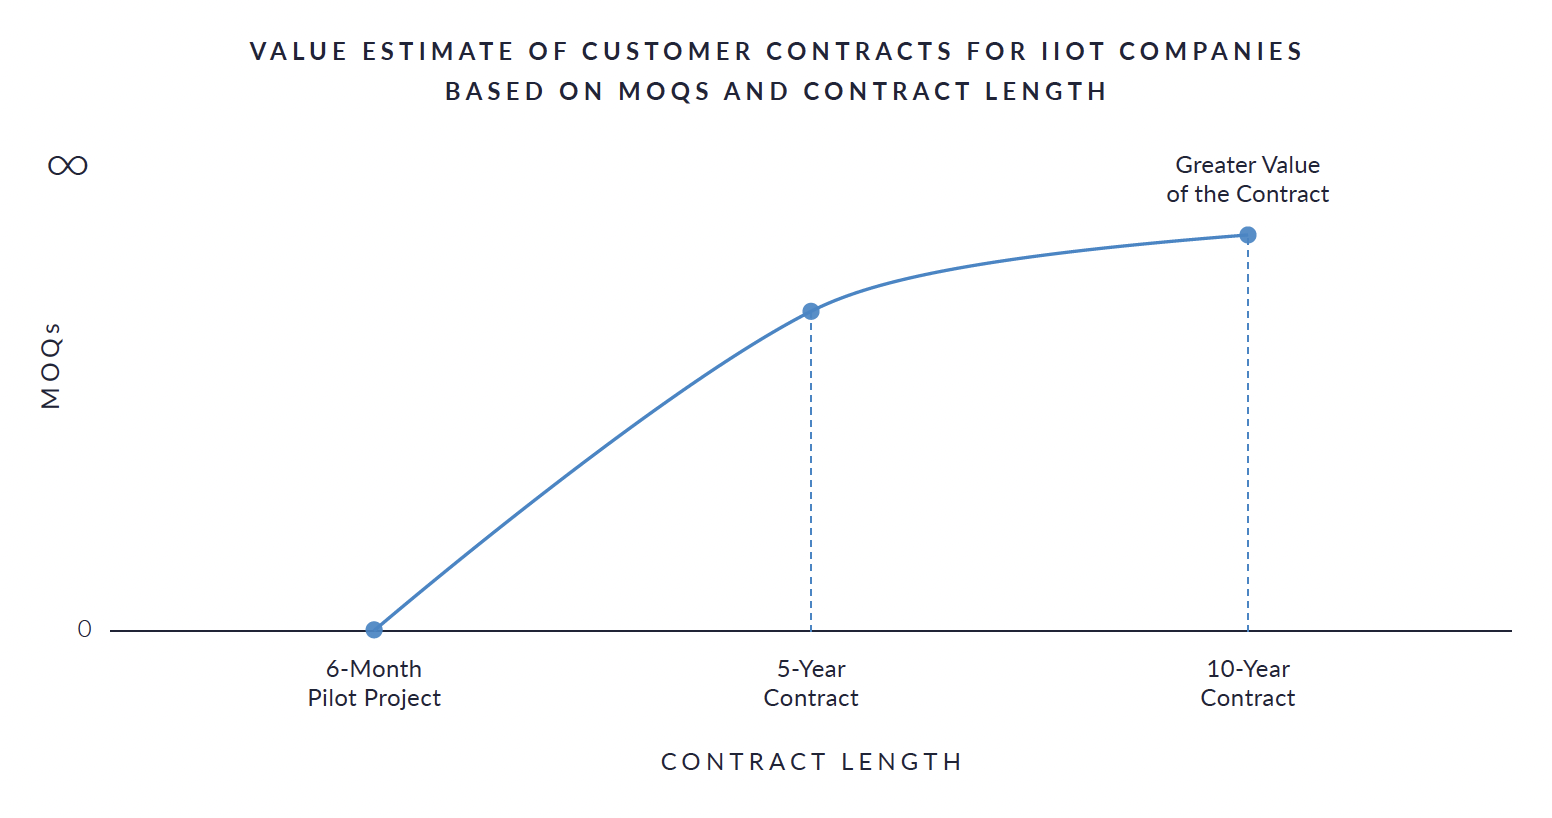
A second component of the contract value is the minimum order quantities (MOQs) for the devices themselves. As already established, IIoT firms’ revenue models revolve around selling or leasing devices and charging recurring fees. IIoT firms are well served to negotiate high minimums with their customers to increase contractual value. This approach allows IIoT firms to offer improved services, software upgrades, and other benefits when customers commit to higher MOQs.
Combining high MOQs with longer contract commitments creates the greatest customer relationship value for an M&A transaction.
Additional Material Contractual Terms
Bundled Contracts
When a company orders a significant number of IIoT devices from a vendor, they pay an initial fee per device and commit to an annual fee per device for several years. In addition to shipping the devices, the vendor provides installation services at an extra cost per device. These bundled contracts consolidate the costs of hardware licenses, software licenses, and essential services into a single agreement.

During the due diligence phase of IIoT M&A transactions, acquiring companies evaluate the existing contracts and commitments of the target companies. Bundled contracts for IIoT devices represent ongoing financial obligations and commitments such as annual fees per device over several years. These commitments can impact the financial projections and cash flow of the acquirer post-acquisition. Bundled contracts often come with specific terms and conditions, including SLAs that guarantee performance metrics such as uptime, response times for support issues, and the reliability of data transmission. These contracts may also include penalties or liabilities in the case of non-performance or breaches. Understanding these contractual obligations helps in assessing the overall financial health and sustainability of the target company’s IIoT investments.
Ownership of Intellectual Property
In M&A transactions, an IIoT company’s intellectual property (IP) constitutes a substantial portion of a company’s overall value. Buyers’ assessments focus on evaluating the strength, scope, and uniqueness of the IIoT company’s IP portfolio to understand how it contributes to market differentiation, potential revenue generation, competitive advantage within the IIoT sector, and financial stability post-acquisition.
Buyers look for synergies between their existing IP portfolio and the IIoT company’s portfolio to assess how they would enhance their product offerings and expand their market reach. They analyze the revenue potential of IP assets, where licensing agreements, royalties, and joint ventures maximize their return on investment through strategic IP commercialization strategies.
The assets of IIoT companies may include patents covering technologies like sensors, data analytics algorithms, and cybersecurity measures; design patents for the unique physical designs of their hardware products; and trademarks to safeguard their brand identities. While copyrights protect software, documentation, and user interfaces. Trade secrets play a crucial role in protecting confidential information such as proprietary algorithms, customer lists, and manufacturing processes.
One notable M&A example of this is General Electric’s (GE) acquisition of Grid Solutions, a subsidiary of Alstom, in 2015. Through this acquisition, GE gained access to Alstom’s extensive IP portfolio related to electrical grid technologies, including patents, trademarks, and proprietary technologies. The acquired IP enabled GE to enhance its product offerings as it included innovations in smart grid solutions, digital monitoring systems, grid automation technologies, and advanced analytics for power networks.
IIoT companies should maintain ownership of their intellectual property and clearly define their portfolio.
Data Ownership
IIoT firms generate vast amounts of data that can be analyzed to gain actionable insights. This data enables real-time monitoring and control of machinery, predicting when maintenance is needed before a breakdown occurs, therefore cutting costs and minimizing downtime. IIoT data also enhances workplace safety by monitoring environmental conditions and employee health, enabling timely interventions to prevent accidents.
Data is a strategic asset in IIoT. Companies with ownership of valuable data can explore various monetization strategies, such as selling data insights, licensing data access, or using data-driven services to generate additional revenue streams. For M&A transactions, acquiring ownership of valuable data assets can strengthen a company’s market position and expand its capabilities. Owning data facilitates smoother integration of systems and technologies post-acquisition. It enables the combining of data sets, integration of analytics platforms, and development of new data-driven innovations that capitalize on synergies between the acquiring and acquired companies.
A relevant M&A example involves Siemens acquiring Mendix in 2018. Siemens not only acquired Mendix’s technology but also gained access to valuable data generated by IIoT applications built on the Mendix platform. Siemens utilized this data to enhance its digitalization offerings, improve operational efficiency for its industrial customers, and accelerate innovation in IIoT solutions.
IIoT firms should own or have the ability to use their customer’s data, even if it is obfuscated.
The Material Impact of Unique Industrial Internet of Things M&A Drivers
It is crucial for business owners considering the sale of their Industrial Internet of Things (IIoT) business to understand the four M&A drivers identified in this report: income statement and balance sheet adjustments, working capital calculations, supply chain risks, and customer relationship measures. Each driver plays a pivotal role in shaping the strategy of an M&A transaction for IIoT firms.