Logistics Automation and Logistics Compliance Software Capital Markets Activity

Between Q1 2020 and Q3 2024, the logistics automation and compliance software sector received over $72 billion in capital across 1,544 deals. The sector plays a vital role in optimizing supply chains by streamlining logistics, reducing costs, and improving efficiency, while also ensuring compliance with complex regulations governing trade, environmental standards, and product safety.
These technologies also support ESG compliance management, including frameworks like TCFD and CDP, which help companies manage climate-related risks and improve sustainability reporting. The ability of these technologies to help companies avoid significant fines related to non-compliance with complex regulations further increases their value. Consequently, investments in this space offer both market growth potential and long-term strategic advantages.
As interest grows in solutions for different logistics transportation modes, such as trucks and railroad, companies aim to optimize multimodal logistics operations. Logistics automation technology includes tools for automating warehouse operations, managing inventory, improving shipping processes, and ensuring compliance with regulatory standards. This often involves managing Bills of Lading (BOLs) and other key documents, ensuring accurate tracking and regulatory compliance across transportation networks.
These technologies assist businesses in navigating complex logistics environments, ensuring faster delivery times and minimizing errors. Compliance software with safety and workflow management tools plays a crucial role in helping companies meet various regulatory requirements, including import/export regulations, safety standards for hazardous materials, and environmental regulations aimed at reducing the carbon footprint of logistics activities. As regulatory scrutiny intensifies across industries like oil and gas, pharmaceuticals, and food and beverage, the demand for compliance solutions continues to grow.


- Between Q1 2020 and Q3 2024, approximately $72 billion was invested in logistics automation and compliance software companies across 1,544 deals. The average deal size was approximately $47 million, reflecting significant capital deployment per transaction in this sector.
- Notable peaks in both deal activity and capital investment occurred, especially in Q1 2022 and Q4 2024. Q1 2022 saw the largest capital deployment of $8.88 billion across 111 deals, marking a period of heightened investment interest.
- A sharp decline was observed in Q4 2022, with only $395 million invested across 77 deals, followed by a significant rebound in Q1 2023, when capital investments surged to $4 billion. This fluctuation can be attributed to heightened economic uncertainty in the latter half of 2022, marked by rising interest rates, high inflation, and growing concerns about a potential recession. Central banks in major economies, such as the US and Europe, aggressively raised interest rates to combat inflation, which increased borrowing costs and created a more cautious investment environment, leading to the slowdown in Q4.
- The market rebound in Q1 2023 likely reflects renewed investor confidence as economic conditions began to stabilize, with inflationary pressures easing and central banks signaling a potential slowdown in the pace of interest rate hikes. Additionally, the lower valuations following the Q4 decline may have presented attractive entry points for investors looking to capitalize on the logistics automation and compliance software sector’s long-term growth potential. This combination of factors helped restore investment activity, resulting in a sharp increase in capital deployment at the start of 2023.
- Despite fluctuations in capital invested, the deal count remained relatively stable, highlighting consistent deal-making activity across the period. However, the size of individual investments varied widely depending on specific market dynamics and major transactions during each quarter.

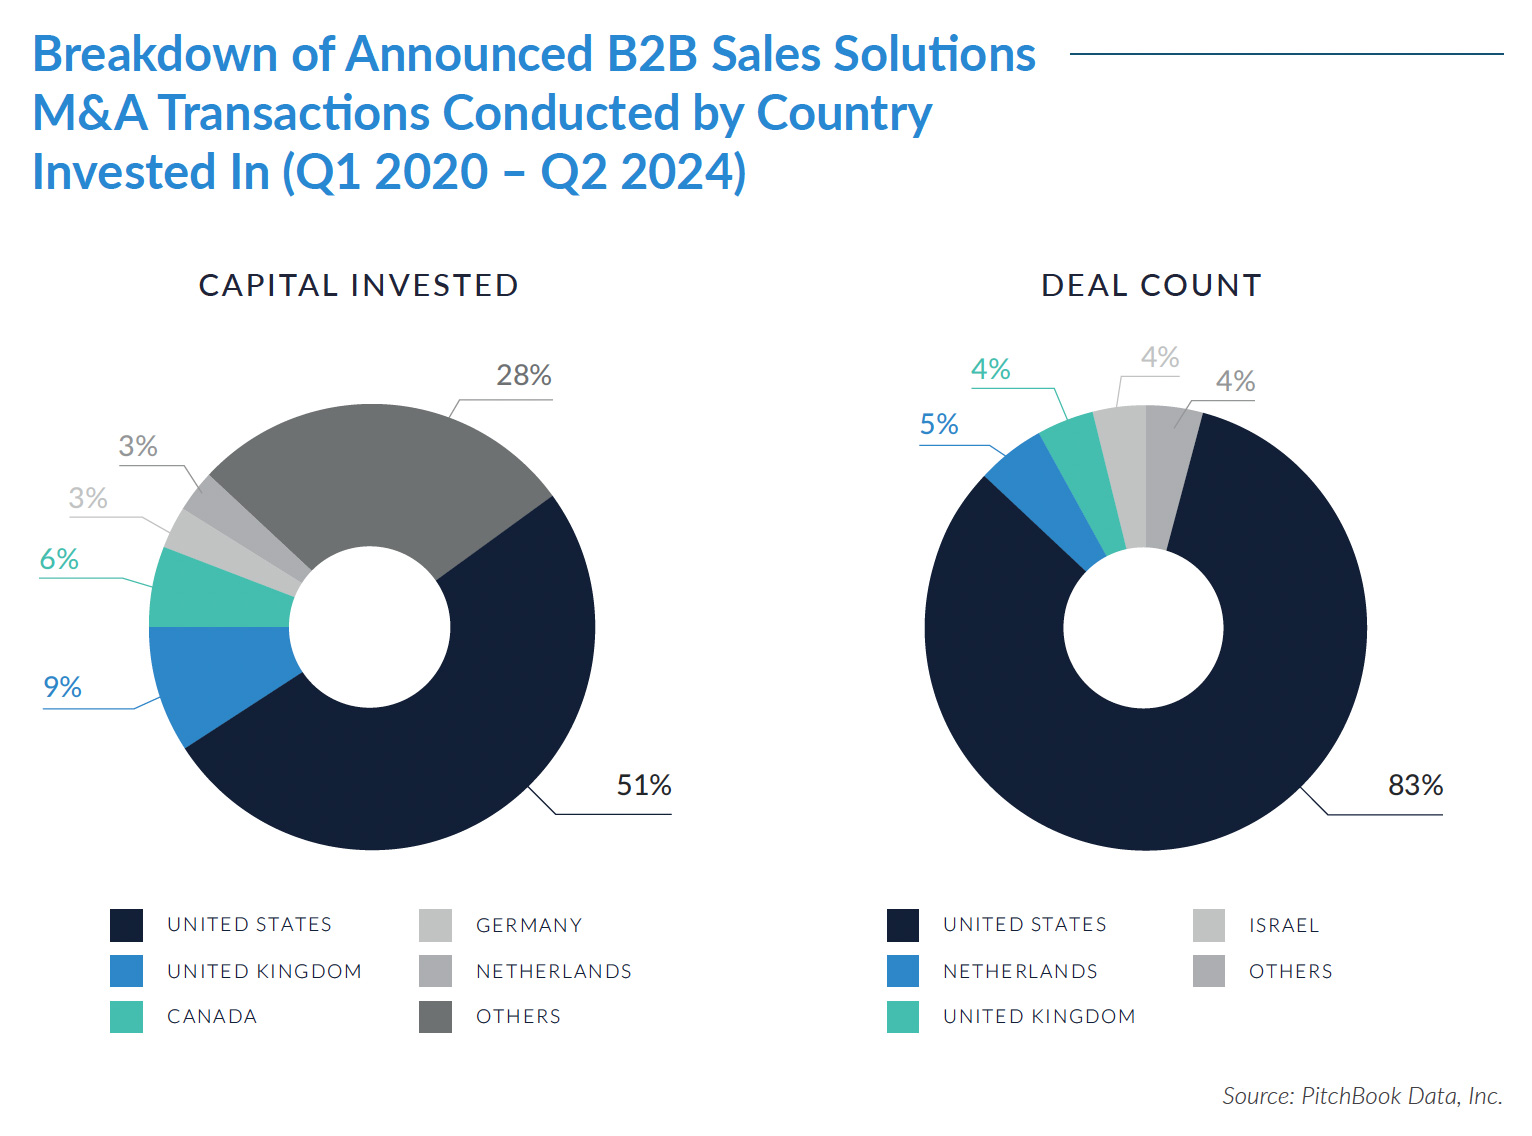
- Between Q1 2020 and Q3 2024, the United States led in capital investments for logistics automation and compliance software, contributing 59% of the total capital invested in the sector. This indicates the country’s strong position in driving innovation and growth in this industry.
- China accounted for 12% of the total deal count during the same period, making it a key player in terms of transaction volume, though its capital investment only reached 15% of the total. This suggests China is involved in numerous smaller-scale deals compared to the larger investments led by the United States.
- While the US and China lead in deal count, countries like the United Kingdom (5%), Germany (4%), and Canada (4%) have also been active in this market. In the United Kingdom, investments often target digital platforms for customs compliance and supply chain management, driven by the need to adapt to post-Brexit regulatory changes. Germany’s deal activity reflects its emphasis on industrial automation, with a focus on optimizing logistics in manufacturing environments to maintain its global competitiveness in exports. Canada’s participation in the market highlights its efforts to improve cross-border trade logistics, especially given its close economic ties with the United States.
- Countries such as Brazil and South Africa, while accounting for a smaller percentage of the total capital invested (around 3% each), are nonetheless contributing to the growing global landscape for logistics automation and compliance software, indicating future potential for growth in these regions.

- A large portion of capital invested ($12 billion) and deal count (306 deals) in logistics automation and compliance software was driven by mergers and acquisitions. This highlights M&As as a preferred strategy for consolidation and expansion within the sector, playing a crucial role in growth and market positioning.
- Buyout and LBO transactions also played a significant role, raising $9.66 billion across 157 deals. This reflects the sustained interest in leveraging acquisitions of mature companies to drive long-term value creation in the logistics and compliance space.
- PIPE transactions contributed $7 billion through 29 deals, showing strong capital flow into public companies looking for private investments to fuel their growth. This shows the importance of private investments in supporting publicly traded firms’ expansion plans.
- Later stage VC deals attracted significant investment, with $3 billion raised through 158 deals. This demonstrates continued investor confidence in more developed companies that have already established a foothold in the market and are seeking additional funding for scaling.
Deal Spotlight:
MERCURYGATE
The Company
MercuryGate, headquartered in Cary, North Carolina, is a leading provider of transportation management system (TMS) software, catering to a range of industries, including logistics, retail, and manufacturing. The company specializes in optimizing freight operations, managing multi-modal transportation networks, and providing end-to-end visibility throughout the supply chain. Its solutions leverage advanced algorithms and data analytics to streamline logistics processes, reduce transportation costs, and enhance delivery performance.
The company was acquired in a buyout transaction by Körber Supply Chain, a global leader in supply chain software and automation, for approximately $395 million on October 31, 2024.


The logistics automation and compliance software sector remains a vital area for investment, with the United States dominating capital deployment. Mergers and acquisitions, representing the majority of deals, reflect the sector’s consolidation trend and its focus on achieving market dominance. As regulatory complexities increase and the demand for supply chain efficiency rises, this sector’s long-term growth prospects continue to attract significant investor interest.
Sources: Insider Monkey, S&P Global, Korber, Grand View Research.