
Creating M&A Value through NRR, LTV, and CAC Measurement in B2B and B2C Businesses
Creating M&A Value through NRR, LTV, and CAC Measurement in B2B and B2C Businesses
Table of Contents

Creating M&A Value Through NRR, LTV, and CAC Measurement in B2B and B2C Businesses
To understand the long-term value of a business, analysts must go beyond traditional financial statements and focus on the economic metrics that drive sustainable returns. Metrics such as Net Revenue Retention (NRR), Customer Lifetime Value (LTV), and Customer Acquisition Costs (CAC) provide deeper insight into how value is created, retained, and expanded over time. Although these metrics are commonly referenced in boardrooms and investor reports, they are often oversimplified. This report introduces a structured and detailed framework for measuring NRR, LTV, and CAC, replacing high-level averages with granular analysis by customer, product, and time periods. Through clear formulas, practical examples, and thought experiments, we demonstrate how these metrics can guide decision-making in both B2B and B2C businesses.
Net Revenue Retention (NRR)
To accurately understand and measure Net Revenue Retention (NRR), businesses must move beyond surface-level averages. At its deepest level, NRR can be analyzed by customers, by product, or by the intersection of both. Additional insight comes from adding a third dimension: time.
To understand the intended measurement of NRR, one must break it down into its most fundamental parts. NRR at the company level is a collection of representative data sets from NRR for specific customers, NRR for specific products, and NRR for specific customers and products together.
To analyze this, let us break down the components of NRR.
NRR CUSTOMER
The NRR for the customer is the revenue retained from that customer by a company over 2 time periods.
NRR PRODUCT
NRR for product is the revenue retained from each individual product, or product category.
NRR CUSTOMER, PRODUCT
NRR is measured over time periods, usually annually or monthly, and we must therefore consider that whatever NRR we are measuring, be it by product, customer, or customer-product together, we are analyzing those NRRs over at least two time periods. Here we can denote them period 1 and period 2.

Therefore, we can finally arrive at the notation for NRR, considering all elements, customer, product, and time, and we would denote it as below.

We will summarize this notation using the subscript N or N+1, since we are seeking to measure customer, products, and customer-product relationships over time periods. The key element here is that the only measure changing in our NRR analysis should be the time periods. The customer, product, or customer-product relationship calculation in time period 1 and time period 2 must remain unchanged for the calculation to be accurate.

This time-based model evaluates NRR at the level of each customer-product-time combination, expressed mathematically as NRR CN,PN,TN. Summarizing NRR notation leads to the below.

It is very easy for business owners and executives to over-generalize NRR data, but unless a NRR data set is built from the ground up with this framework in mind, it is likely that NRR calculations will inaccurately represent the true NRR of the business, potentially leading to incorrect conclusions and poor decision-making.
Rather than viewing NRR as a static figure, this method allows companies to track how revenue from each unique customer and product pair evolves from one period to the next. For instance, the NRR of customer 1 for product 1 in period 1 is compared directly to the same customer-product pair in period 2. By doing this across all customers and products, the model highlights precise signals of expansion, contraction, and churn.
The transition from one time period to another clearly illustrates which customer segments and products are driving net growth, and which ones are dragging it down. This level of resolution is critical for subscription businesses.
Calculating NRR by Measuring Customer, Product, and Time
Net Revenue Retention (NRR) across a company or product line is not calculated as a simple average of each customer’s NRR. Instead, it is a weighted average, reflecting the actual revenue contribution of each customer.
CALCULATING NRR BY CUSTOMER
To understand this impact, consider an example. Imagine two customers:
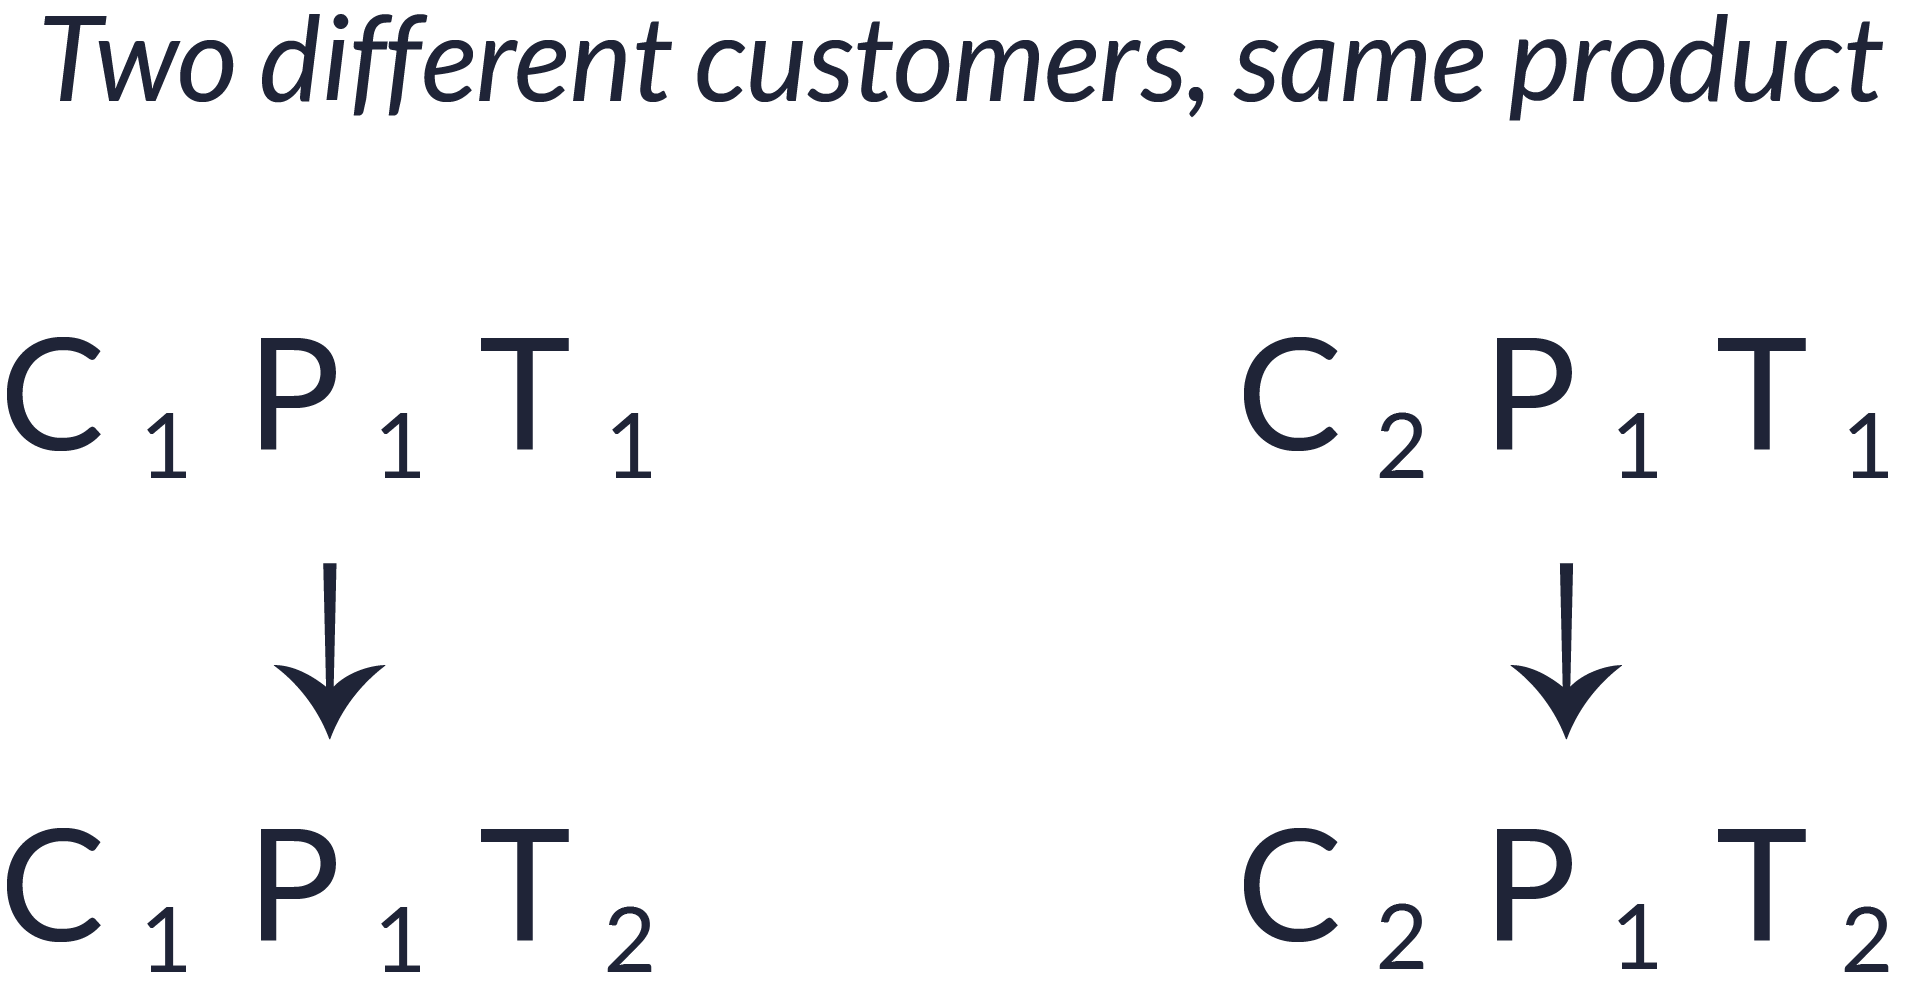
In this example, customer 1 grows significantly and represents the majority of revenue, while customer 2 grows modestly and represents less. If you simply average each NRR, the result will be incorrect. The correct company-level NRR must reflect the distribution of revenue between the two.
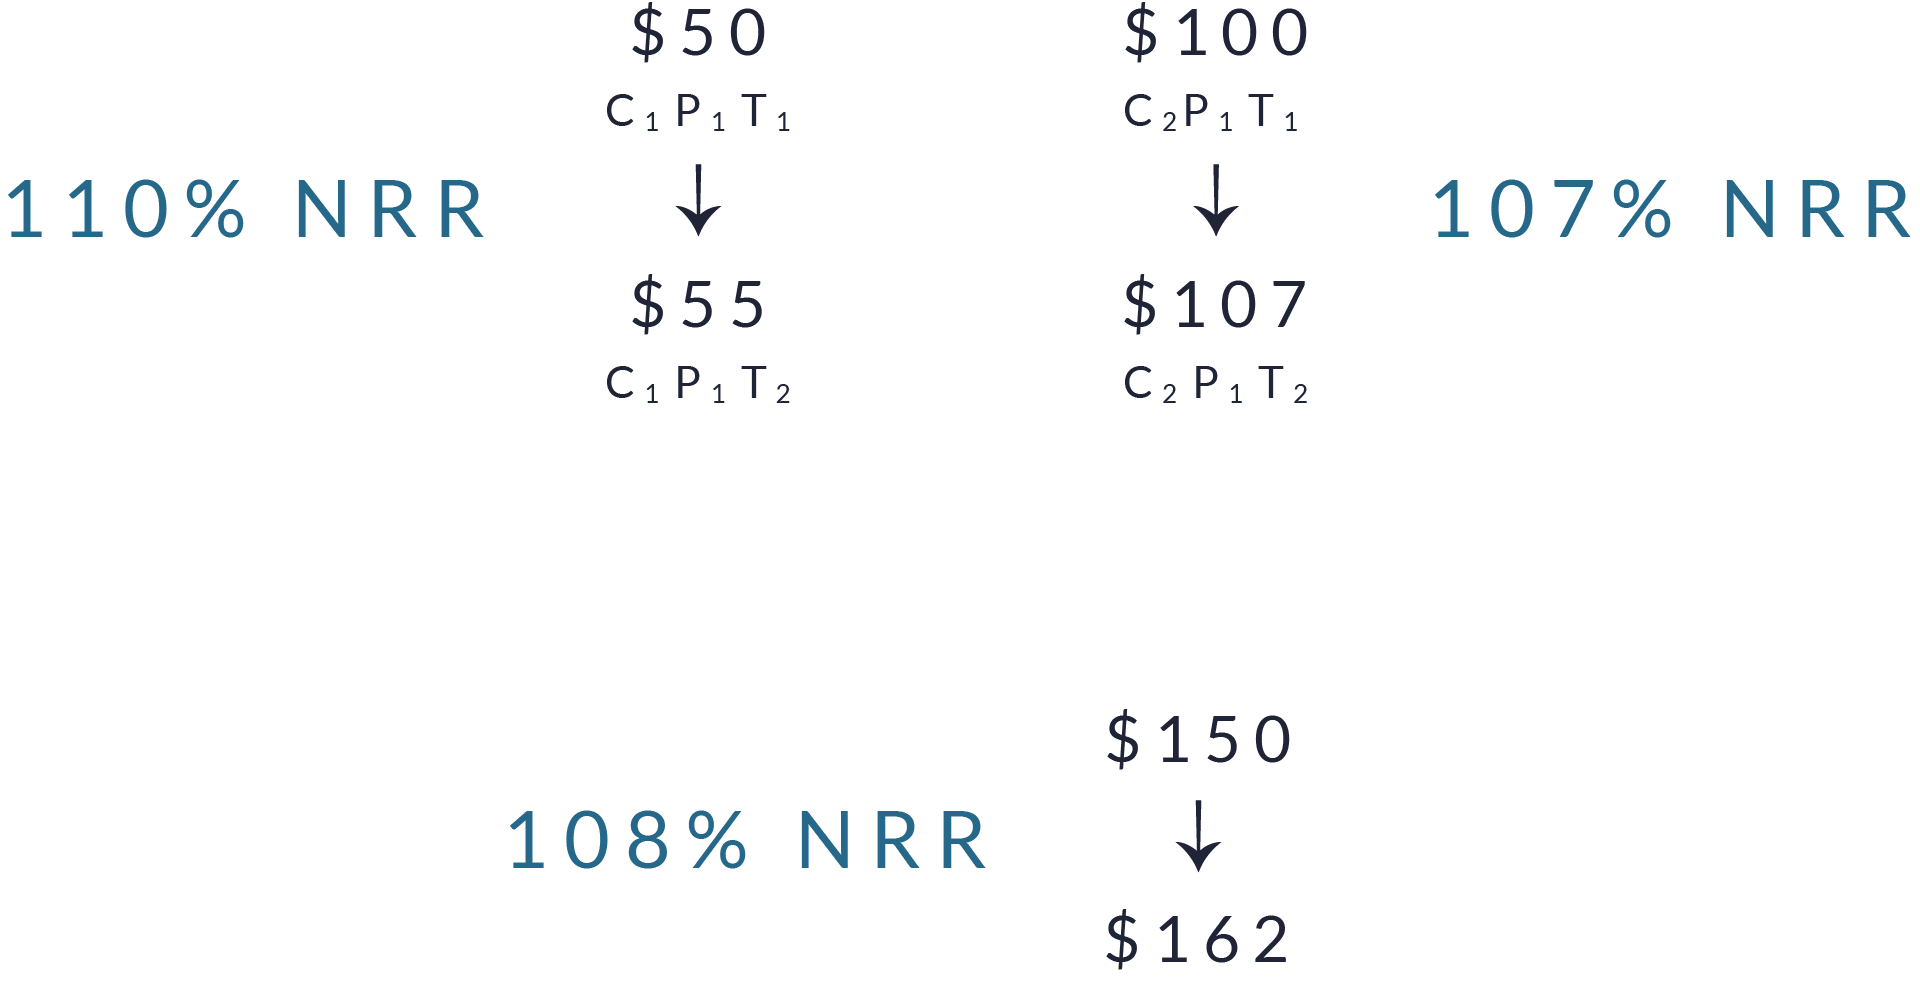
In the example provided, customer 1 generates $50 from product 1 in time period 1 and grows to $55 in time period 2, resulting in an individual NRR of 110%. This reflects full retention of prior revenue with an additional 10% expansion.
When multiple products or customers are analyzed together, their growth is aggregated based on their original revenue weights. For instance, a set of product lines might grow modestly from $25 to $26.75, resulting in a total weighted NRR of 107%. At the company level, total revenue from existing customers may increase from $80 to $86.4, yielding a broader NRR of 108%.
While each customer or product line may grow at similar rates, their actual impact on NRR depends on their share of revenue in the base time period. A small percentage increase on a large revenue base (customer 1) has a far greater effect than a significant percentage increase on a small base.
Example
Three different NRRCustomer with three different implications.
CALCULATING NRR BY PRODUCT
Instead of looking at NRR as just one number for the whole company, this approach breaks it down by product to see how each product performs over time.
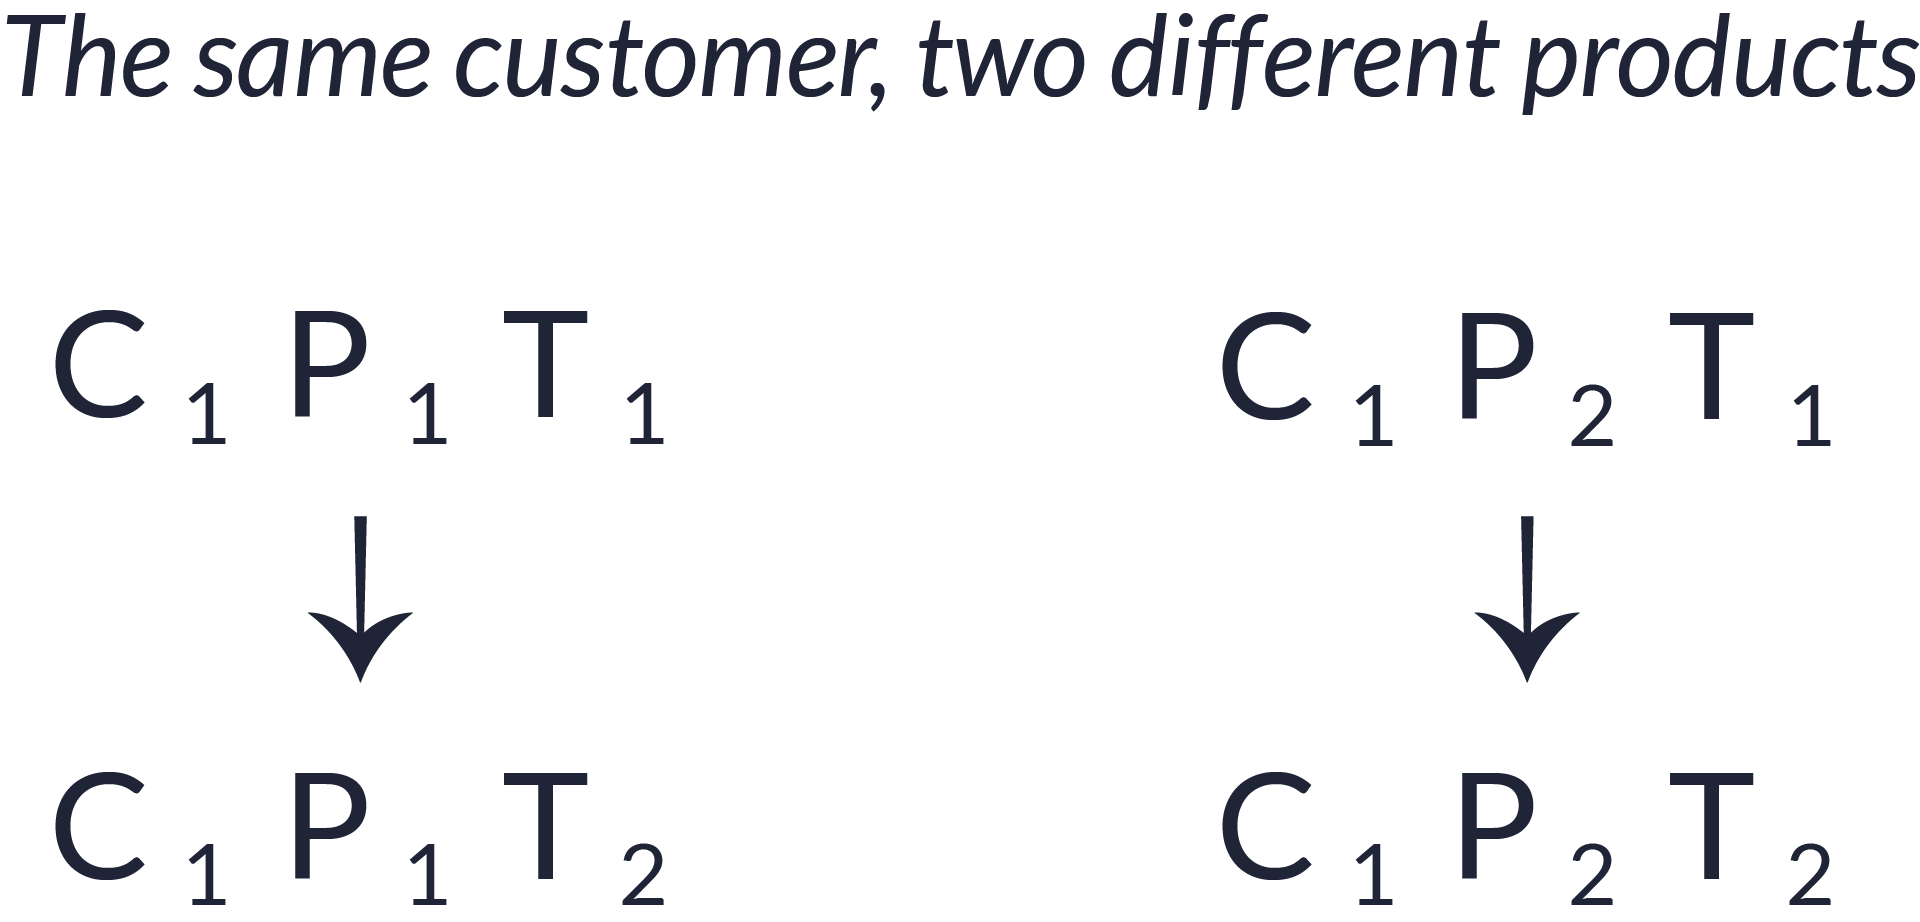
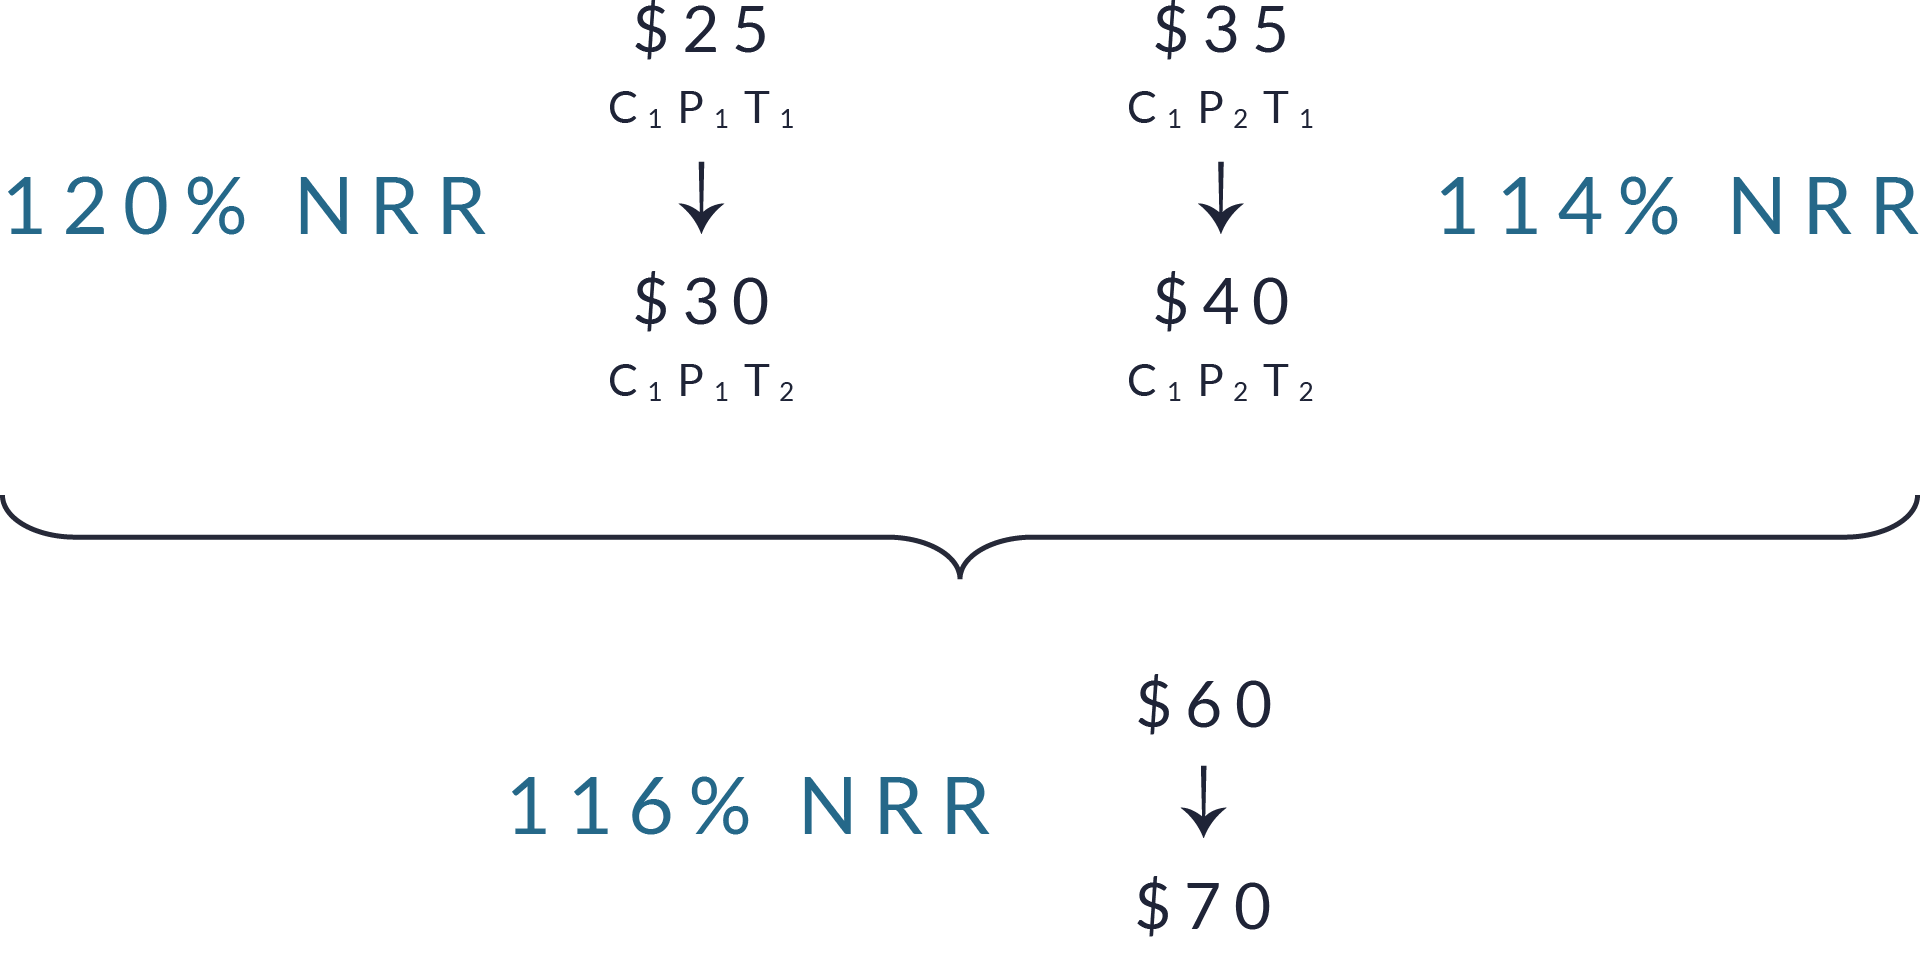
In the example shown, customer 1 spends $25 on product 1 and $35 on product 2 in time period 1, for a total spending of $60. In time period 2, overall spending increased to $30 for product 1 and $40 for product 2, raising the total to $70. This means product 1 has an NRR of 120%, and product 2 has an NRR of 114%. When we combine them, the total NRR across both products is 116%.
Each product is measured separately, and only revenue from customers who used that product in T₁ is included. While both products grew, product 1 had a slightly greater impact because its revenue increased by a larger percentage. This product-level view helps teams understand which products are growing the most within existing customers, and where there might be opportunities to improve, again leading to better decision making, such as product relevancy, pricing, and marketing decisions.
Example
Two NRRProduct for a single customer NRR.
What if one NRRProduct is declining?
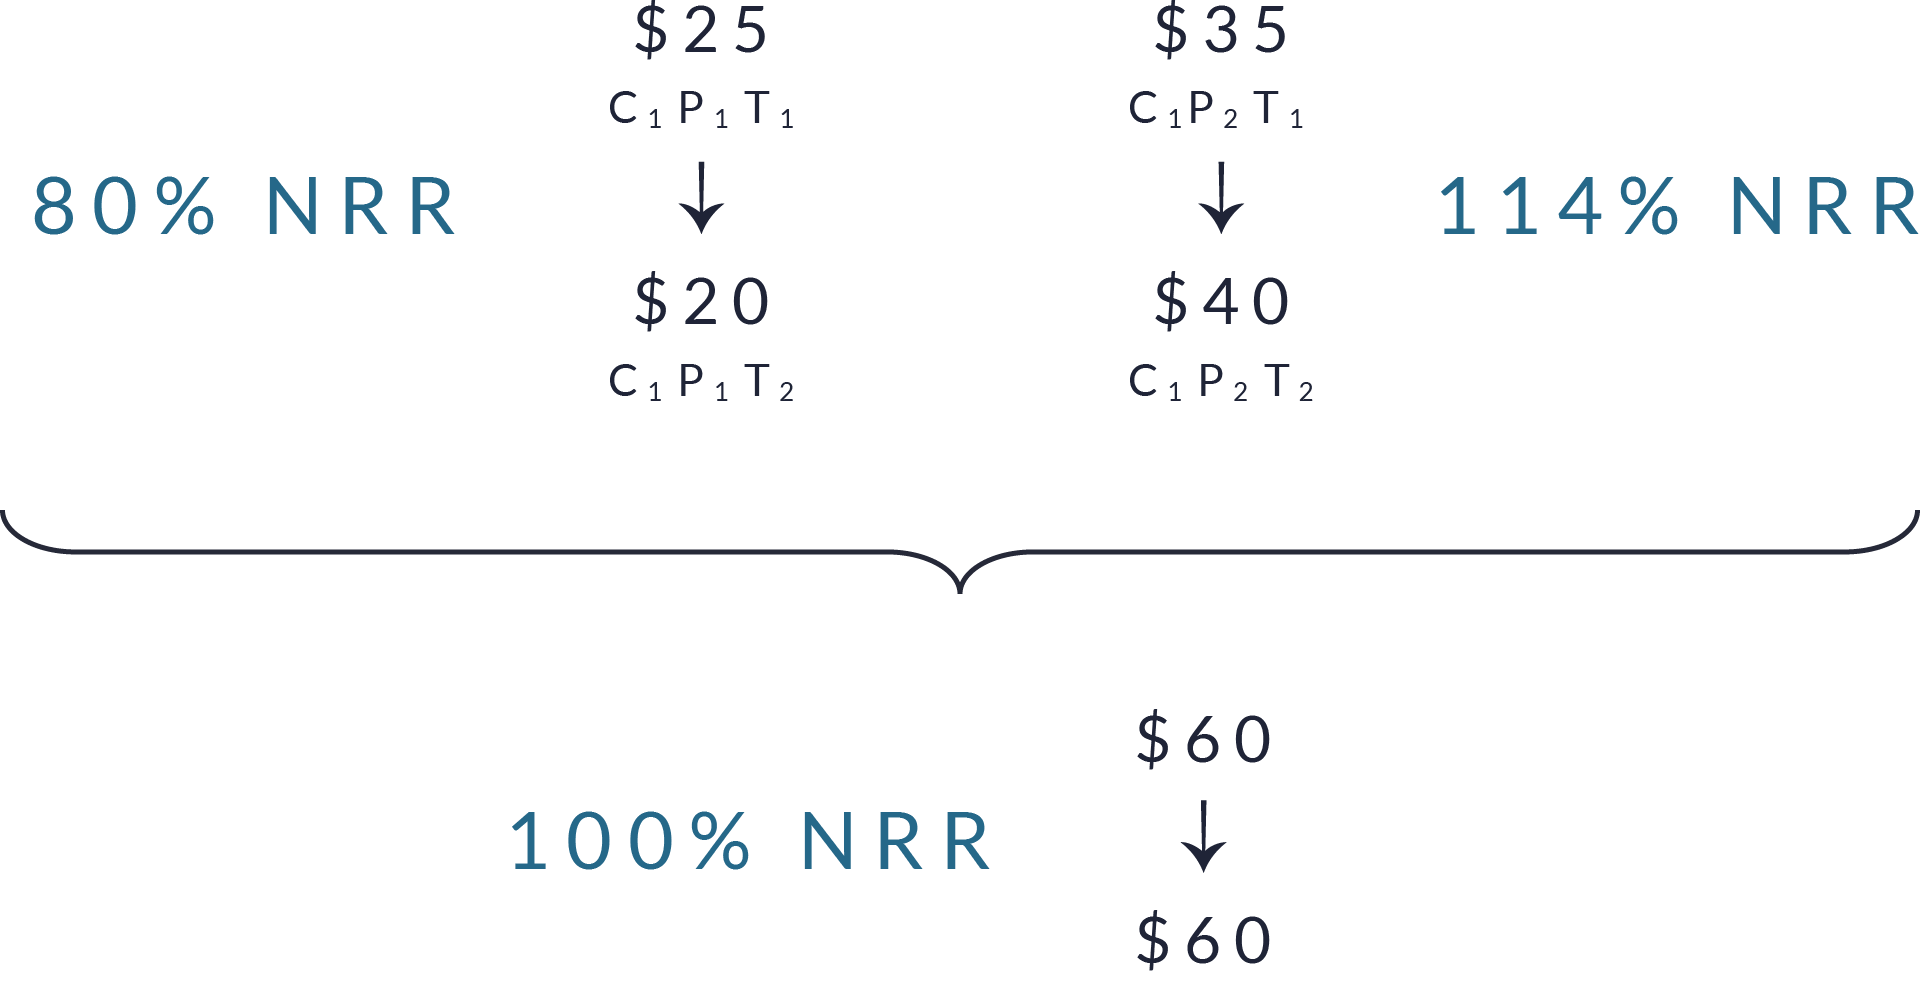
This framework also helps reveal what happens when one product’s NRR is declining, even if other products are growing. In the example provided, customer 1 spent $25 on product 1 in T₁, but only $20 in T₂, resulting in an NRR of 80%, which signals a 20% drop in revenue for that product. Meanwhile, product 2 increased from $35 to $40, giving it an NRR of 114%. Although product 1 shrank and product 2 expanded, total revenue across both products stayed the same at $60 in both periods, leading to a combined NRR of 100%. This means the revenue loss from product 1 was completely offset by the growth in product 2.
Even though the overall number may look stable, this view shows the importance of understanding the dynamics of underlying shifts between products. A flat NRR at the company level can still hide important product-level trends like churn in one area and growth in another which makes product-specific analysis critical for accurate decision-making.
Example
Declining NRRProduct hidden by increasing revenue for the same customer.
In the diagram provided below, we see how NRR is calculated first at the level of customer–product–time, such as customer 1’s product 1 from time period 1 to time period 2 and then aggregated to the customer level by combining all products purchased by that customer. These customer-level NRR values are then rolled up to produce a total company NRR.
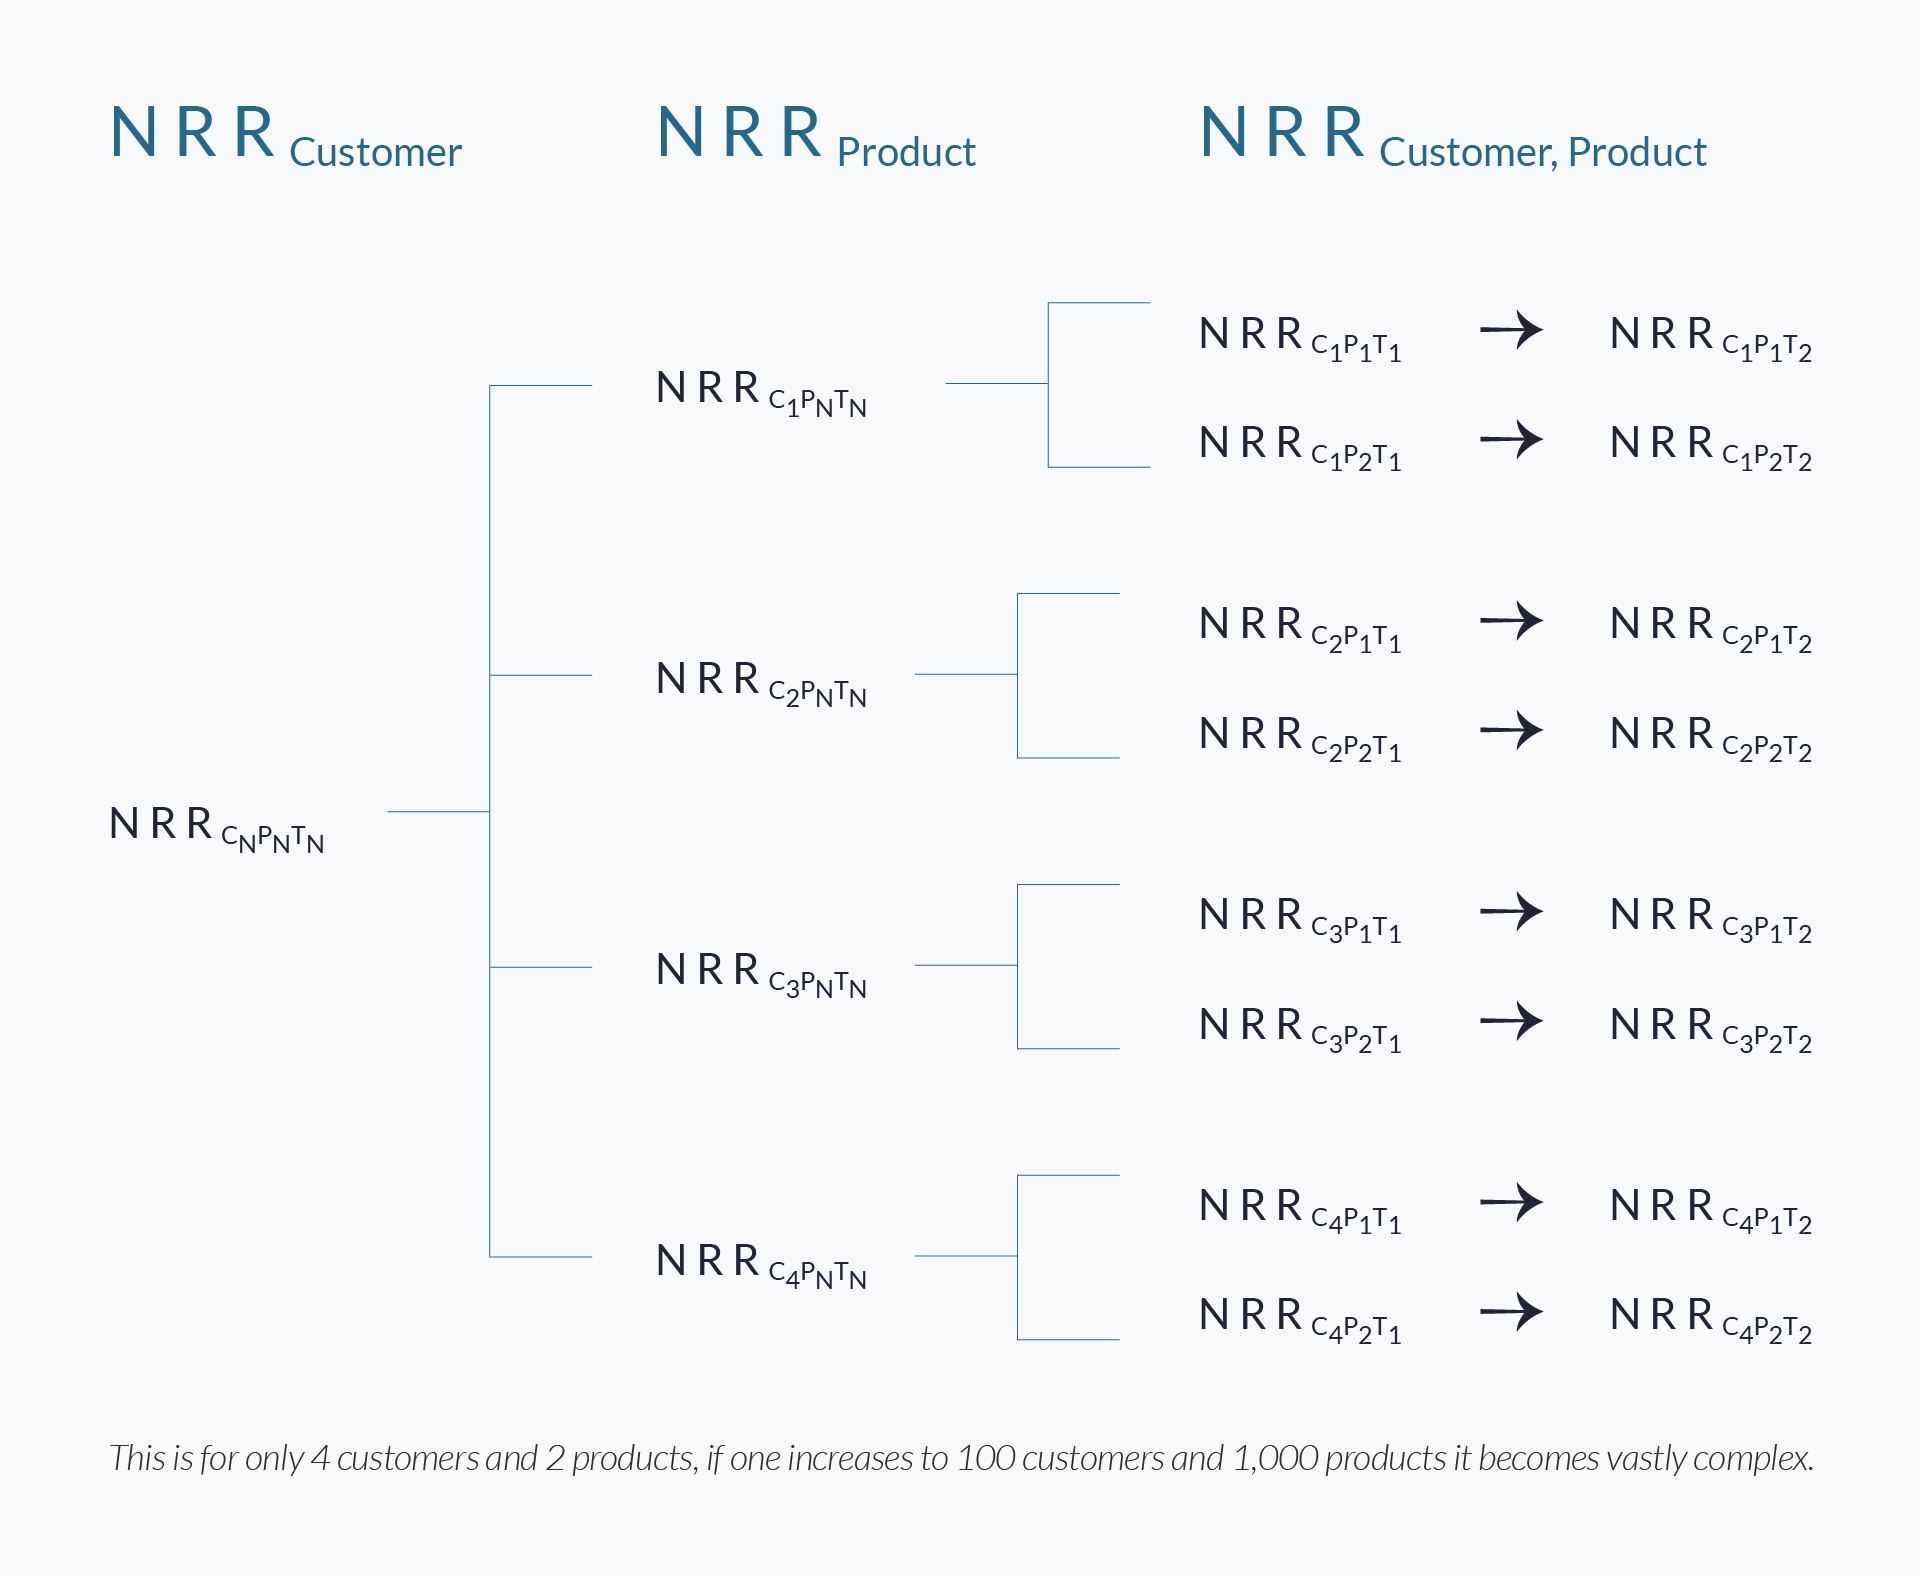
While the diagram illustrates only four customers and two products, scaling this model to reflect 100 customers and 1,000 products creates a matrix of millions of possible revenue combinations across time periods. Each of these interactions must be tracked individually to understand how retention, expansion, or contraction at the product level affects customer-level NRR, and how customer-level shifts ultimately shape the company’s overall revenue health. This highlights the need for a structured, data-driven approach, one that captures the full complexity of revenue movement rather than relying on broad averages that mask the details.
Lifetime Value (LTV)
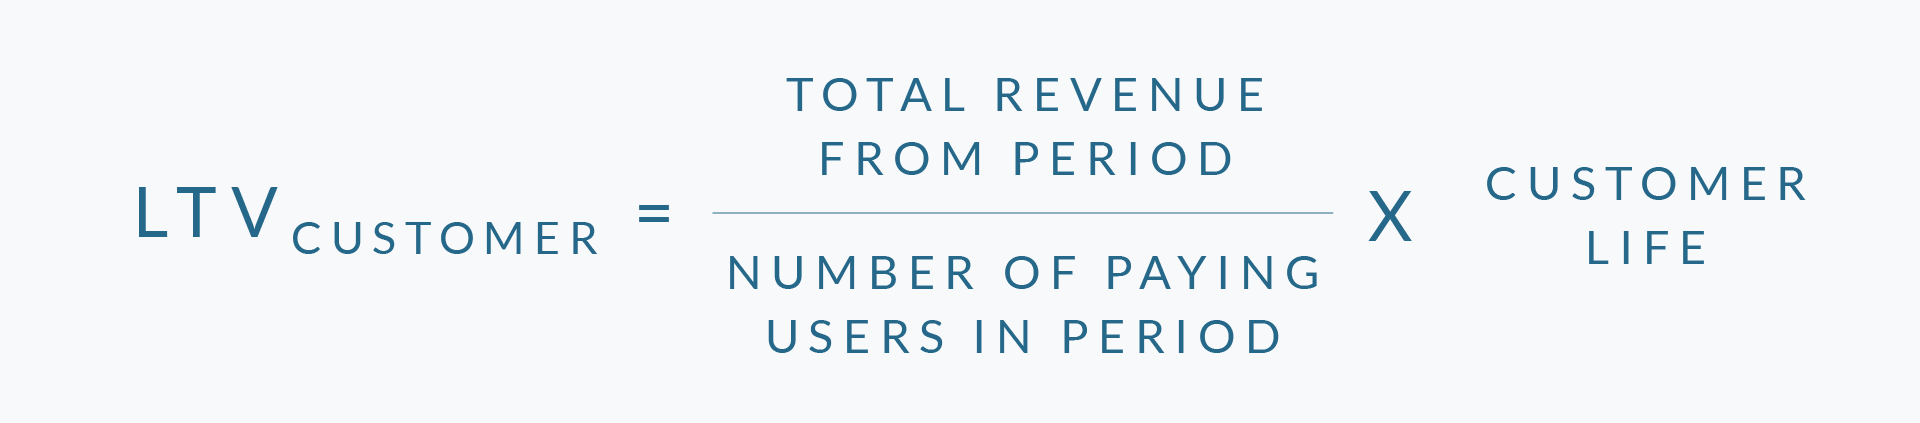
A similar detailed level analysis can be applied to LTV. LTV is made up of three major variables, Average Revenue per User (ARPU), broken down into revenue from the customer base, number of customers in that base, and the length of time that customer remains active (usually represented in months or years). To perform a specific analysis of LTV, one must consider the effort required to change any of the three major variables.

An increase in revenue generated from each user leads to a rise in ARPU, which in turn drives an increase in Customer Lifetime Value (LTV).

Conversely, if total revenue remains flat while the number of paying users increases, ARPU will decline. This highlights the need for revenue growth to at least match user growth to preserve LTV economics. Additionally, extending the duration of the customer relationship, measured by the length of time a user remains a paying customer, has a direct and positive impact on LTV, making customer retention a critical driver of long-term value. Combining these two equations together, we get:
Businesses with high Customer Lifetime Value (LTV) often outperform peers with stronger short-term revenue metrics but weaker retention or expansion models. This is because LTV captures not just how much a customer pays, but how long they remain a customer and how deeply they engage over time. In this context, depth of engagement refers to the frequency, breadth, and profitability of a customer’s interactions with the business, such as increased spending, adoption of multiple products, subscription renewals, participation in loyalty programs, or responsiveness to upsell opportunities. Said differently, one should focus on keeping customers for as long as possible and deprioritize pricing strategies if they want to maximize LTV.
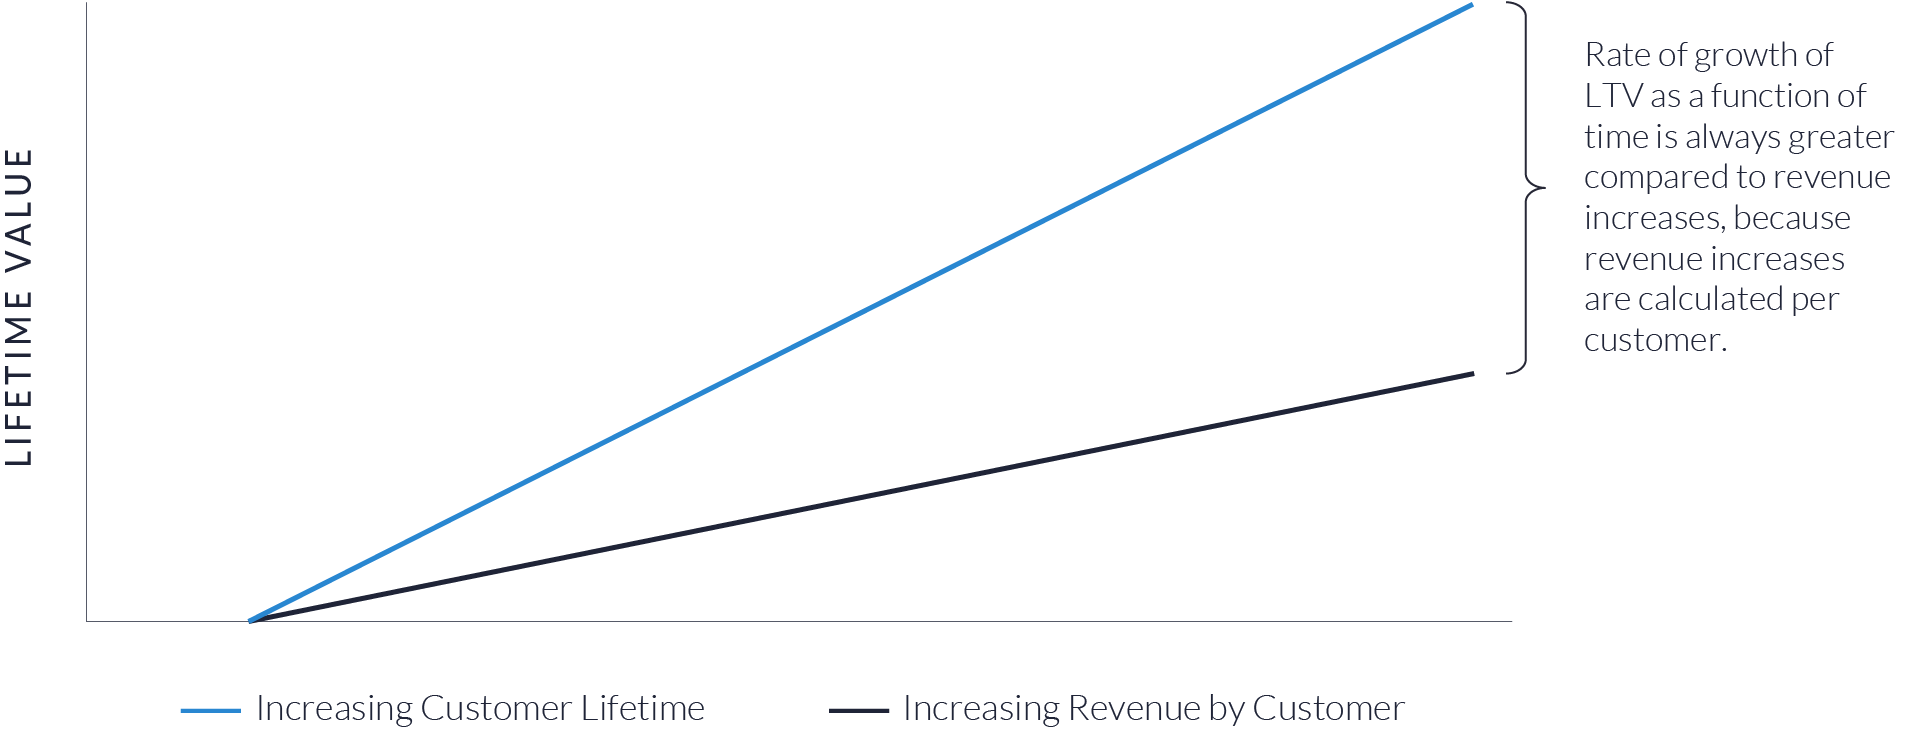
Unlike revenue per customer, which is typically measured in fixed intervals like months or years, LTV reflects the cumulative value of a customer relationship. As shown in the chart, LTV growth consistently outpaces revenue growth per customer. Even if per-customer revenue remains flat or grows modestly, LTV can increase significantly due to compounding effects from longer retention. In fact, small improvements in customer lifetime or monetization can lead to disproportionate gains in LTV, making it a more sensitive and strategic metric than price increases alone.
By focusing on LTV, companies shift from transactional thinking to a relationship-driven model that prioritizes sustainable value creation through loyalty, expansion, and lifetime engagement.
Customer Acquisition Costs (CAC)
Customer Acquisition Cost (CAC) is one of the most critical metrics for evaluating the sustainability and scalability of any business, whether it operates in a consumer-facing (B2C) environment or a business-to-business (B2B) context. At its core, CAC quantifies how much a company must spend on marketing and sales to acquire a single customer. But while the concept may seem straightforward, the inputs, implications, and optimization strategies vary significantly across sectors, platforms, and business models.
CACB2C
In B2C environments, CAC is often tied to digital advertising performance where impressions, clicks, and conversions are measured in real time across paid media channels.

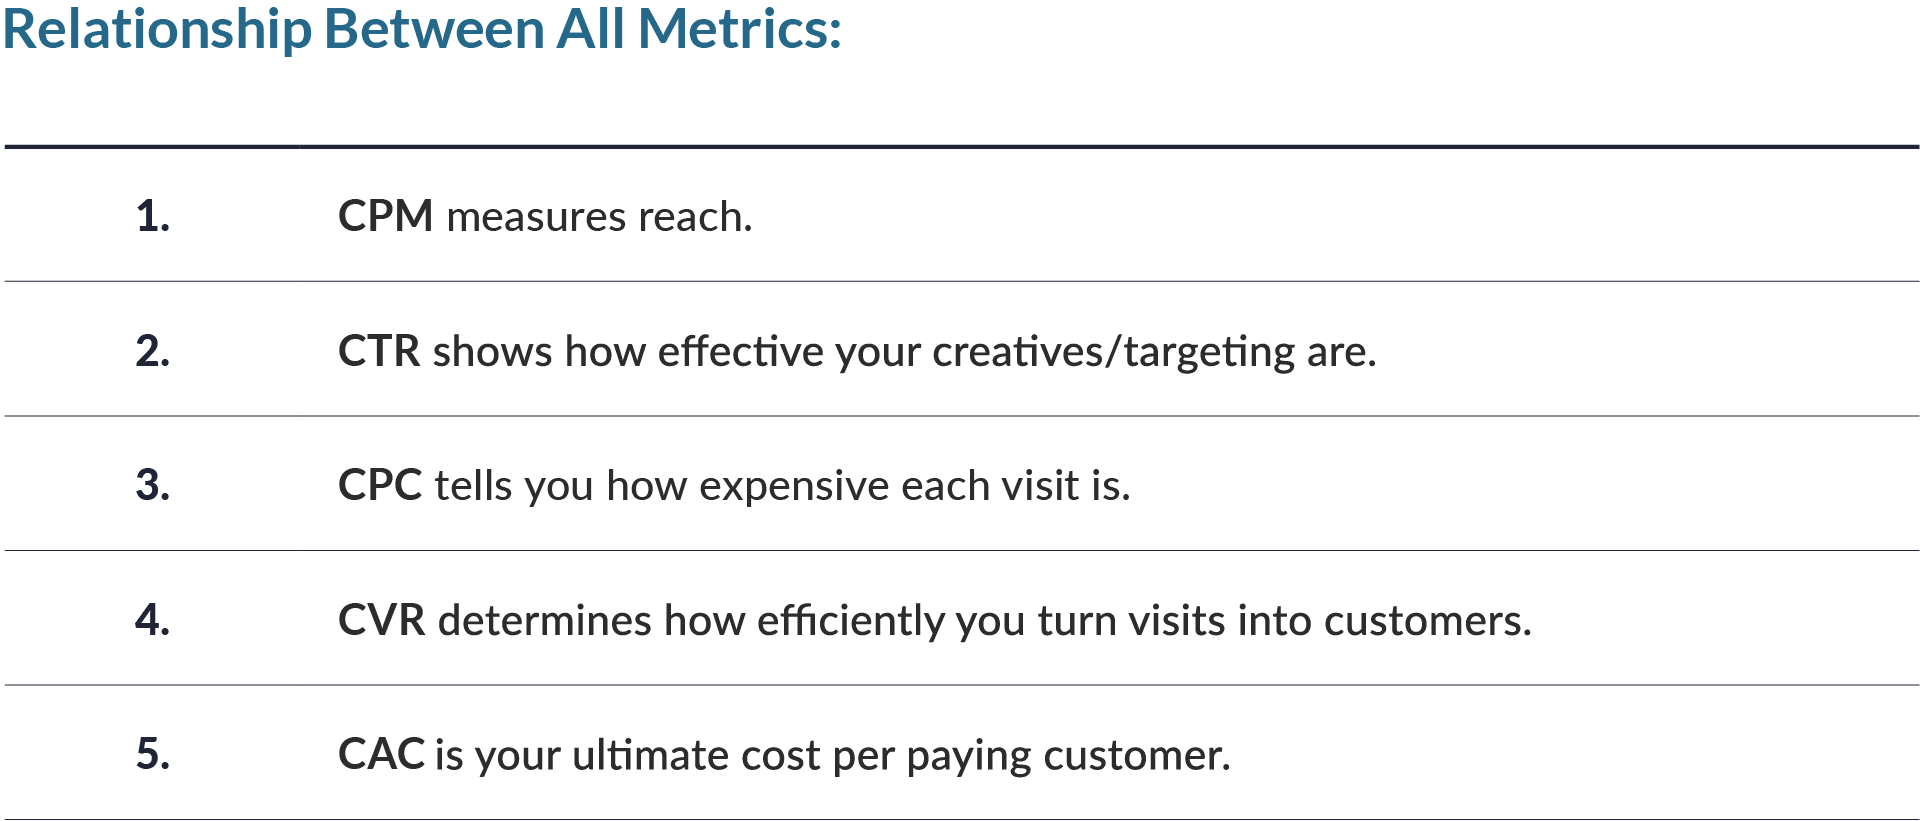
Here, marketers rely on performance metrics like CPM (cost per thousand impressions), CTR (click-through rate), and CVR (conversion rate) to diagnose and optimize customer journeys. These variables create a clear, formula-driven approach to calculating CAC and help tie ads directly to customer acquisition outcomes.
The total ad spend is calculated by multiplying the number of impressions (divided by 1,000) by the CPM. The number of clicks is then determined by multiplying impressions by CTR. From this, the cost per click (CPC) is the total ad spend divided by the number of clicks, which simplifies to CPM divided by (1,000 × CTR).
Since CAC is defined as the total cost divided by the number of conversions, and conversions equal clicks multiplied by CVR, CAC becomes CPC divided by CVR. Substituting CPC, the final formula for CAC can be represented by:
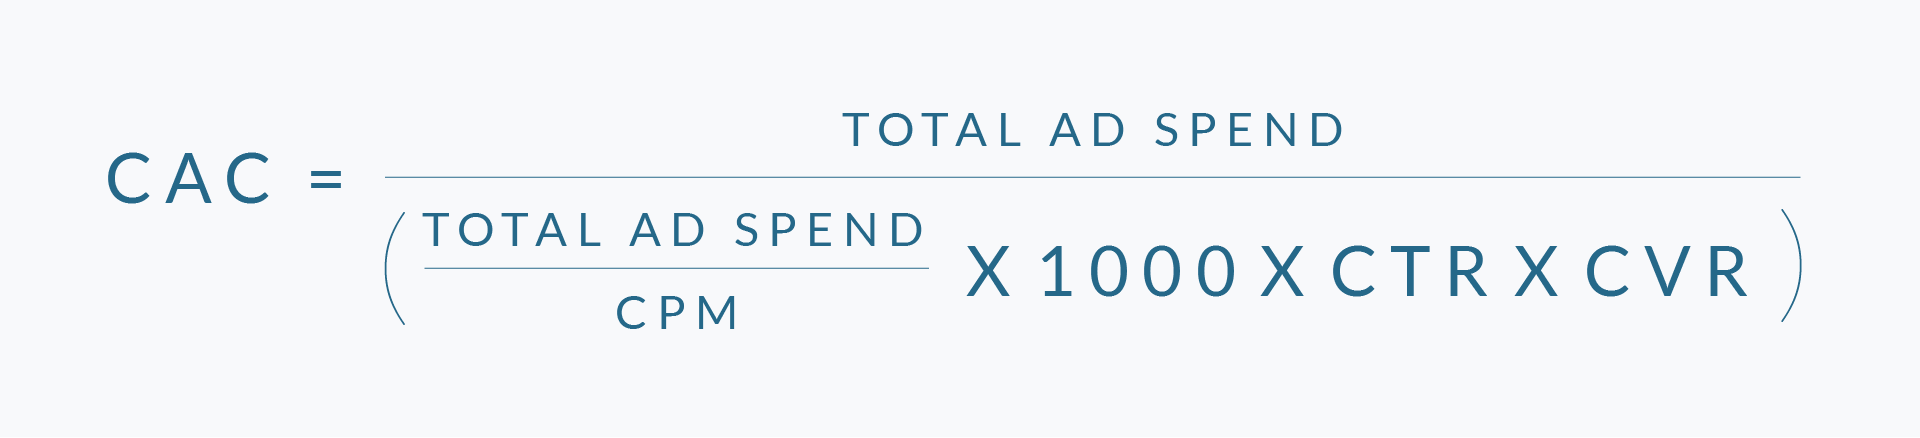
There are multiple ways to express Customer Acquisition Cost (CAC), but one of the most insightful for B2C ties CAC directly to the ad metrics: CPM (Cost per Mille), CTR (Click-Through Rate), and CVR (Conversion Rate).
The formula below expresses CAC in terms of total ad spend for the entire CACB2C equation.
Therefore becomes:

The Customer Acquisition Cost (CAC) formula connects high-level advertising metrics to actual spending, making it easier to understand CAC in concrete financial terms. It expresses CAC as total ad spend divided by the number of customers acquired through that spend, where the number of acquired customers is derived from CPM (cost per thousand impressions), CTR (click-through rate), and CVR (conversion rate from click to purchase). Specifically, it calculates the number of impressions generated by the total spend (using CPM), the number of resulting clicks (via CTR), and the number of those clicks that convert to paying customers (via CVR). This funnel approach grounds ad performance metrics in real cost-per-customer terms, enabling more precise financial analysis and better optimization of marketing budgets.
You can calculate CAC through CPM or CPC, but both depend on CTR and CVR. This equation is powerful for B2C marketers managing multi-platform campaigns, helping them balance cost-efficiency across upper and lower funnel metrics.
Now for our thought experiment.
CACB2B
In the realm of business-to-business (B2B) commerce, acquiring new customers is often complex and resource-intensive. Unlike business-to-consumer (B2C) environments, B2B sales cycles are longer, involve multiple stakeholders, and usually demand a high degree of personalization and trust. While these dynamics do not directly alter the mathematical structure of Customer Acquisition Cost (CAC), they do affect how and when acquisition costs are incurred and recovered.
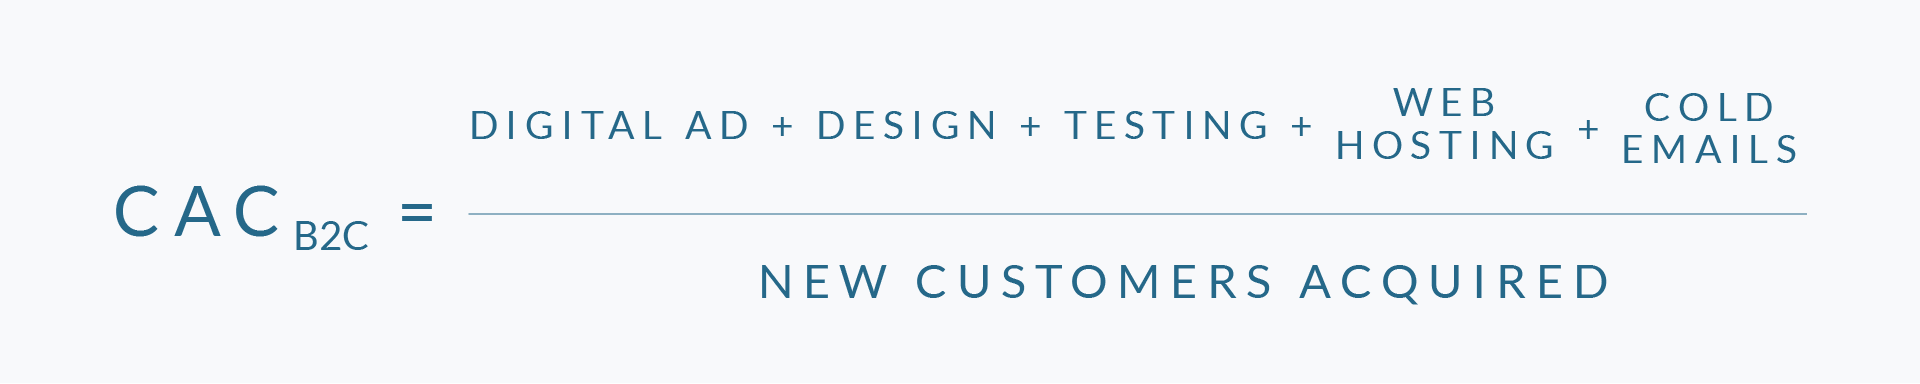
CAC in B2B begins with the foundational equation:
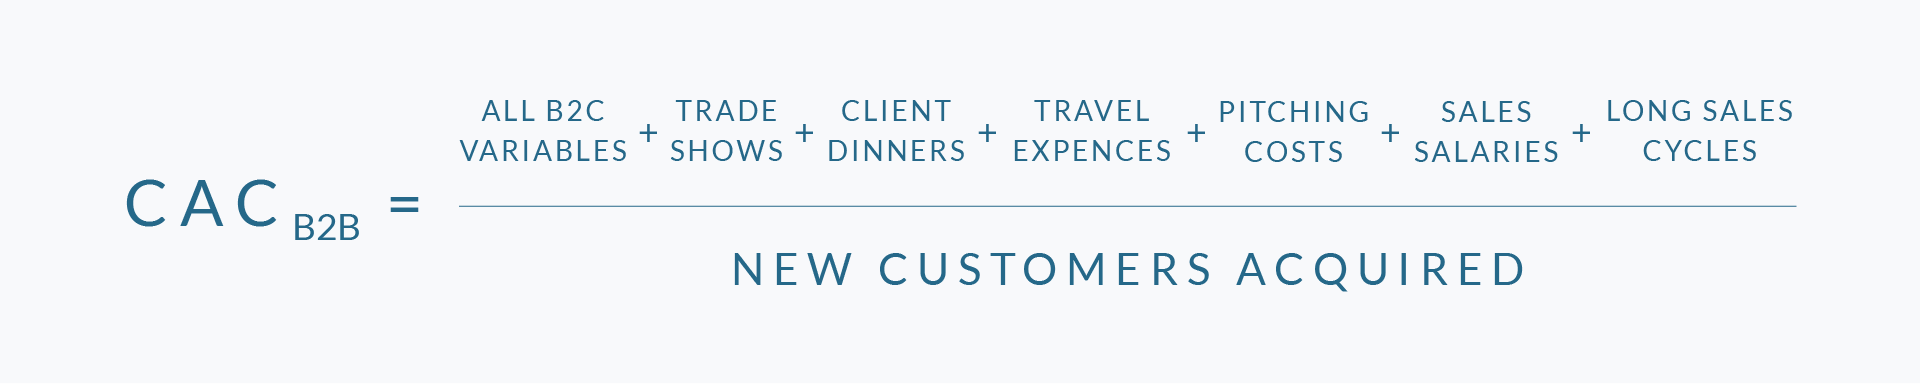
This formula captures the essence of how much a company must invest to secure each new client. While simple in appearance, the challenge lies in accurately defining and attributing both the numerator (sales and marketing costs, including personnel, tools, content creation, and paid campaigns) and the denominator (customers acquired within a given period, adjusted for churn and qualification). We explore these variables in detail, offering strategic frameworks and practical benchmarks that B2B organizations can use to assess CAC efficiency and align customer acquisition with long-term revenue and margin goals.
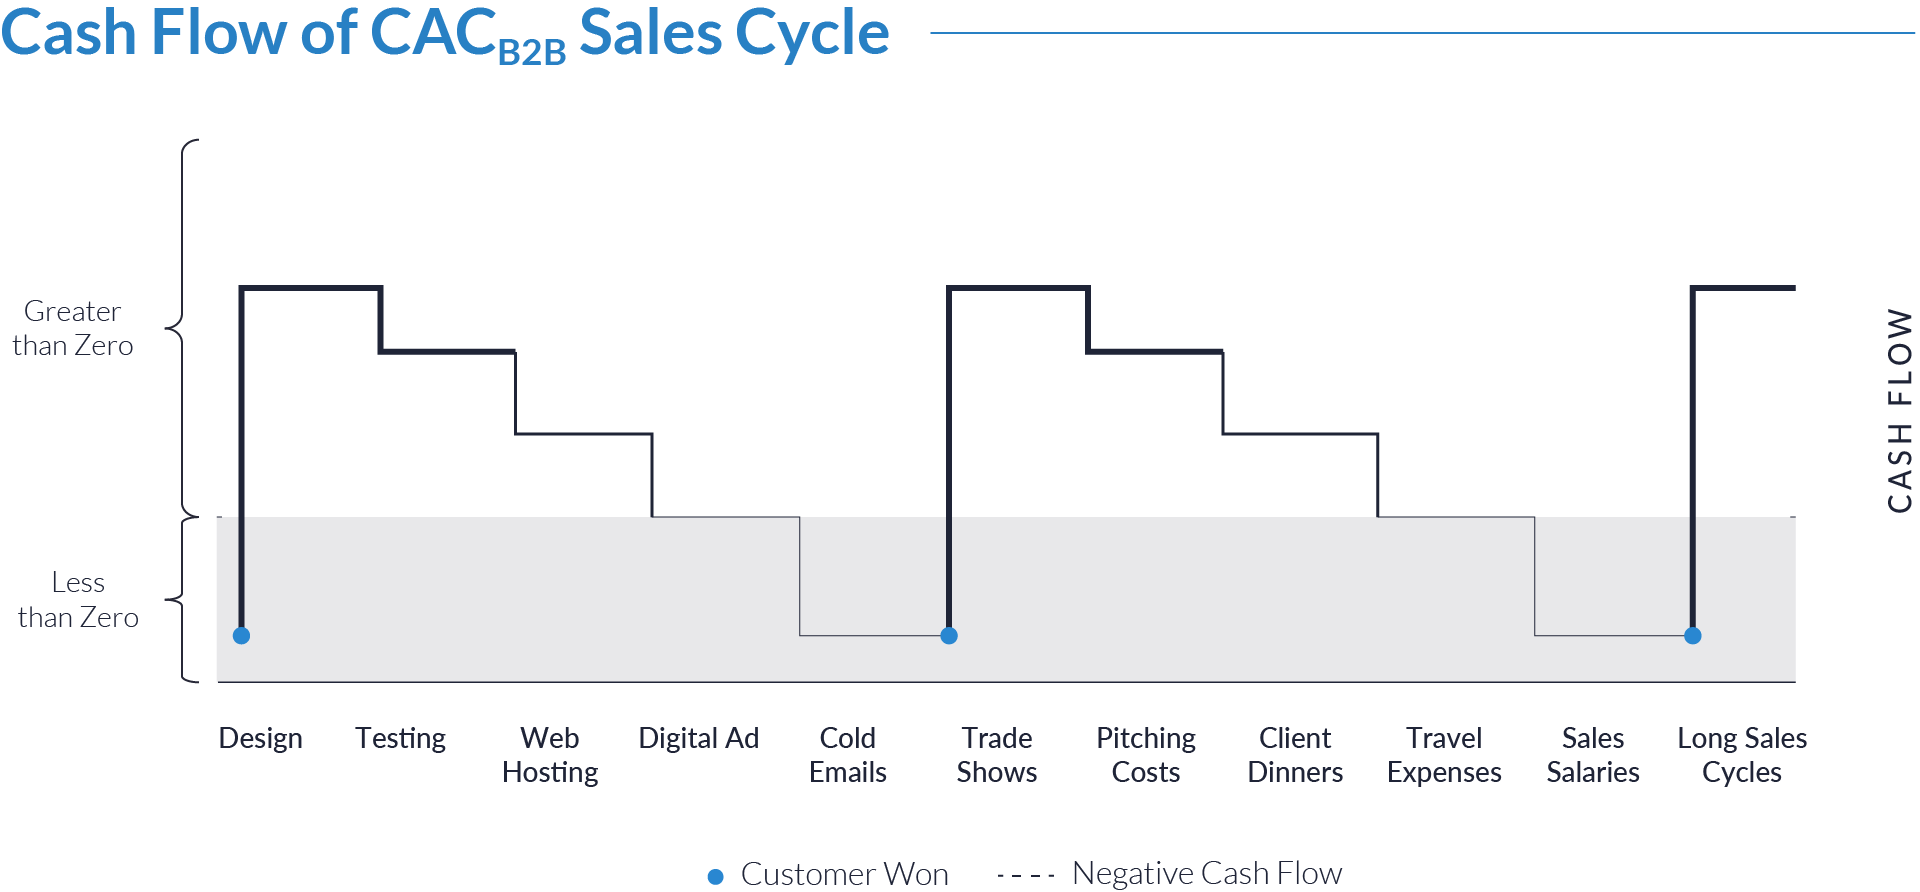
In B2B, sales cycles are often long and complex, ranging from weeks to months or years. During this time, companies incur significant upfront costs across marketing, operations, and sales before any revenue is recognized. The greatest risk in creating an advantageous CAC for B2B businesses is cash flow. Because of elongated sales cycles, cash flow becomes the most important driver of how CAC:LTV ratios can drive a firm’s profitability.
Key expense categories include marketing and lead generation, such as digital ads, design, testing, web hosting, cold emails, and trade show costs that are incurred early and often without guaranteed results. Sales and conversion efforts, including client dinners, travel expenses, pitching costs, and fixed sales salaries, add to the burden regardless of deal outcomes.
The dotted line shows a point where a company starts losing money on its sales pursuits. Companies must consider ways to shift expenses to avoid falling below the dotted line for extended periods of time. Revenue and cash flow timing are even more important based on how companies record their financials. Companies often use terms for revenue, such as booked, annualized, or recurring, and all have different connotations for their associated measurement of cash flow. Booked revenue is collected over time, so comparing CAC to booked revenue can distort cash flow measurement and make a company’s performance seem stronger than it really is. For example, a CAC of 100 and a booked revenue of 200 for a 4-year recurring contract would seem to indicate a 1:2 CAC: LTV ratio, which is positive for the company. But on a cash measurement basis, booked revenue over a 4-year period would be collected at 25% per year, or 50 in this example. It would therefore take this company 2 years to reach cash flow break-even and 3 years to become cash flow positive despite having a CAC: LTV ratio of 1:2.
Structural challenges like extended sales cycles exacerbate cash flow issues by delaying payment collection and straining reserves. This creates a high burn rate, with front-loaded costs and back-loaded revenue causing cash gaps; unpredictable closing dates make forecasting difficult and risky.
Companies often face resource constraints that hinder reinvestment in growth without external capital and become dependent on financing like venture capital or credit lines. To mitigate these challenges, companies must engage in careful cash flow planning, track customer acquisition cost payback periods, monitor pipeline velocity, explore faster-to-close sales motions such as product-led growth or freemium models, and tightly integrate sales forecasting with expense management to prevent liquidity issues.

The Importance of NRR, LTV, and CAC Measurement Specificity
When companies measure NRR, LTV, and CAC with precision, they gain powerful tools to evaluate performance, guide investment decisions, and shape strategy. These metrics do more than reflect financial outcomes, they reveal the real dynamics behind customer behavior, product usage, and spending efficiency. Net Revenue Retention shows how existing customers increase or decrease in value over time. LTV quantifies the long-term economic benefit each customer delivers. CAC connects that value to the cost of bringing new customers onboard. By analyzing these metrics together across time, product lines, and customer segments, companies unlock a complete view of where they create value and where they face risks. Business leaders who master these insights build smarter models, improve operational resilience, and position their companies for long-term success.
THOUGHT EXPERIMENT 1
Customer Lifetime Value (LTV)
Question:
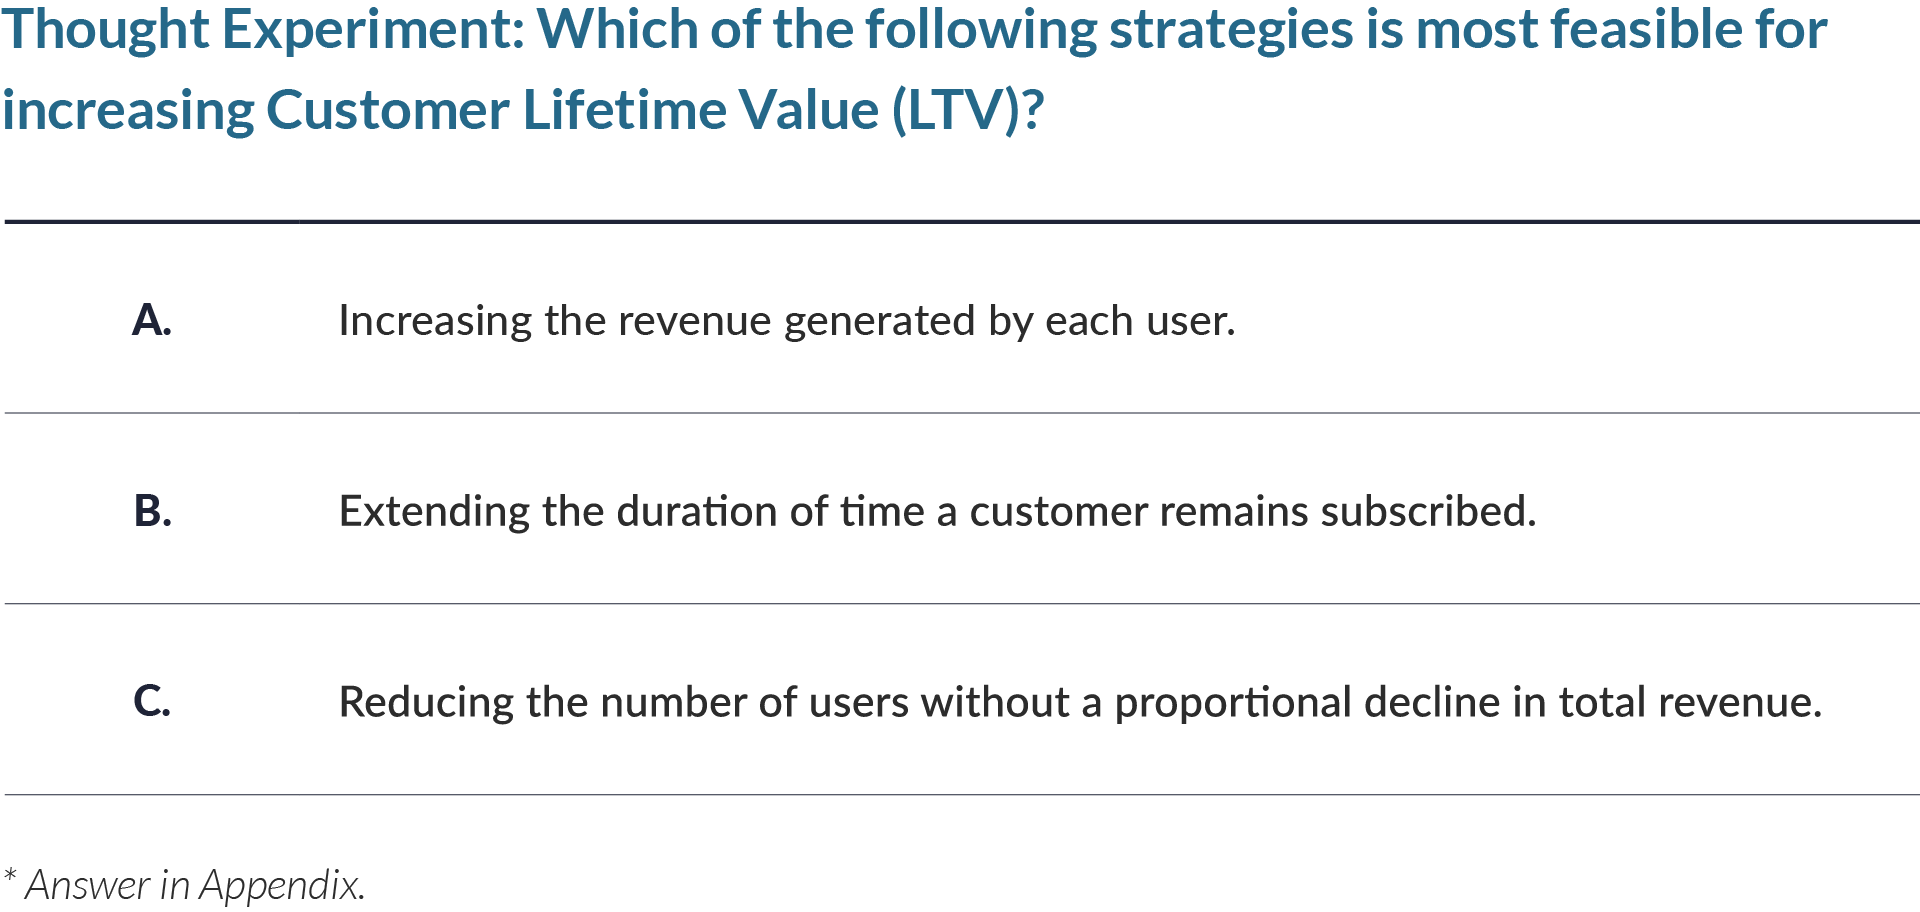
Which of the following strategies is typically more feasible for increasing Customer Lifetime Value (LTV)?
Options:
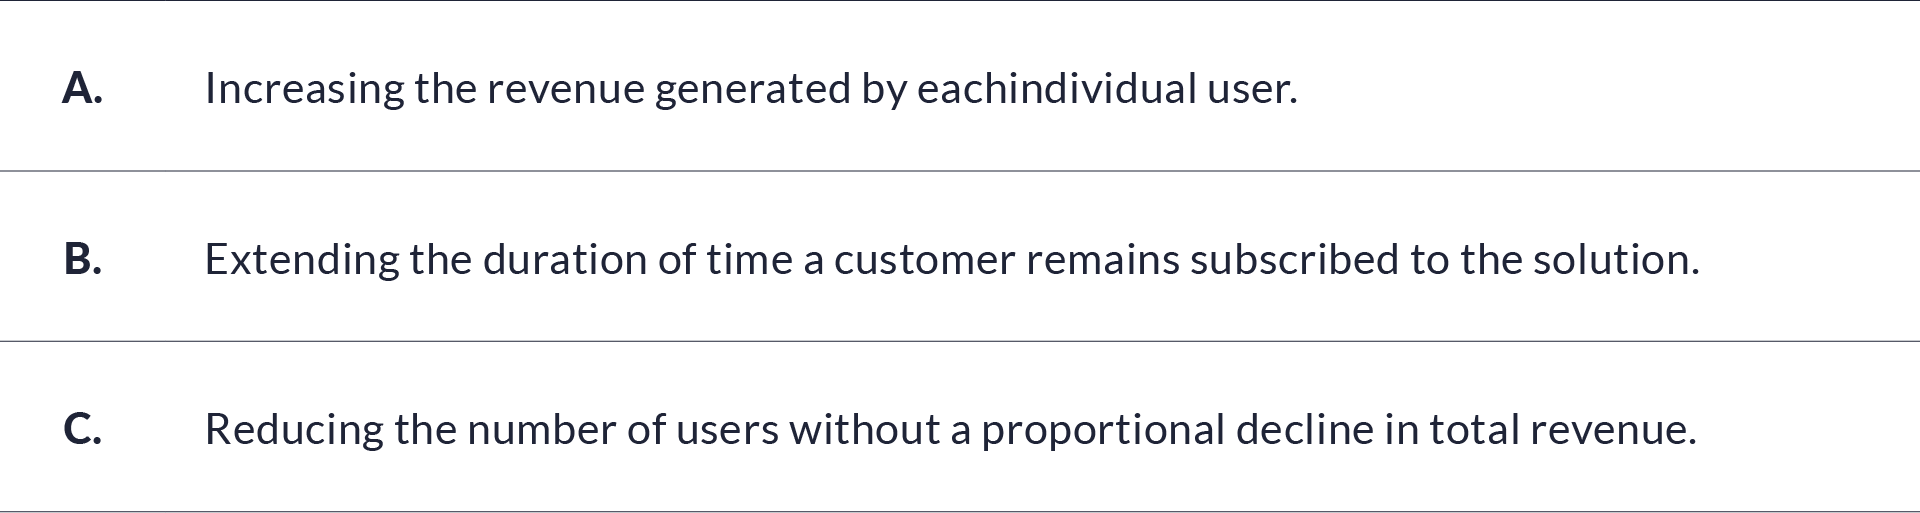
Answer:
B, extending the duration of time a customer remains subscribed.
Each option A, B, and C can have a positive impact on LTV, but the more important question is which option can be performed with great ease and least investment. Option B is the more achievable and sustainable level for increasing LTV. Option A is a common practice, but revenue increases on the scale of 5% or 20% are most common, with an increase in revenue by 50% being abnormally high, whereas a 50% increase in customer lifetime can be illustrated as a customer going from a 6-month contract to a 9-month contract, a much more feasible solution. Option C is likely the second easiest option of the 3. Removing unprofitable customers or removing customers who do not have LTV requirements of the company are both the same ways to implement option C. But reducing customers without a proportional reduction in revenue is more difficult than simply motivating existing customers to subscribe for longer.
THOUGHT EXPERIMENT 2
Customer Acquisition Cost (CAC) – B2C
Question:
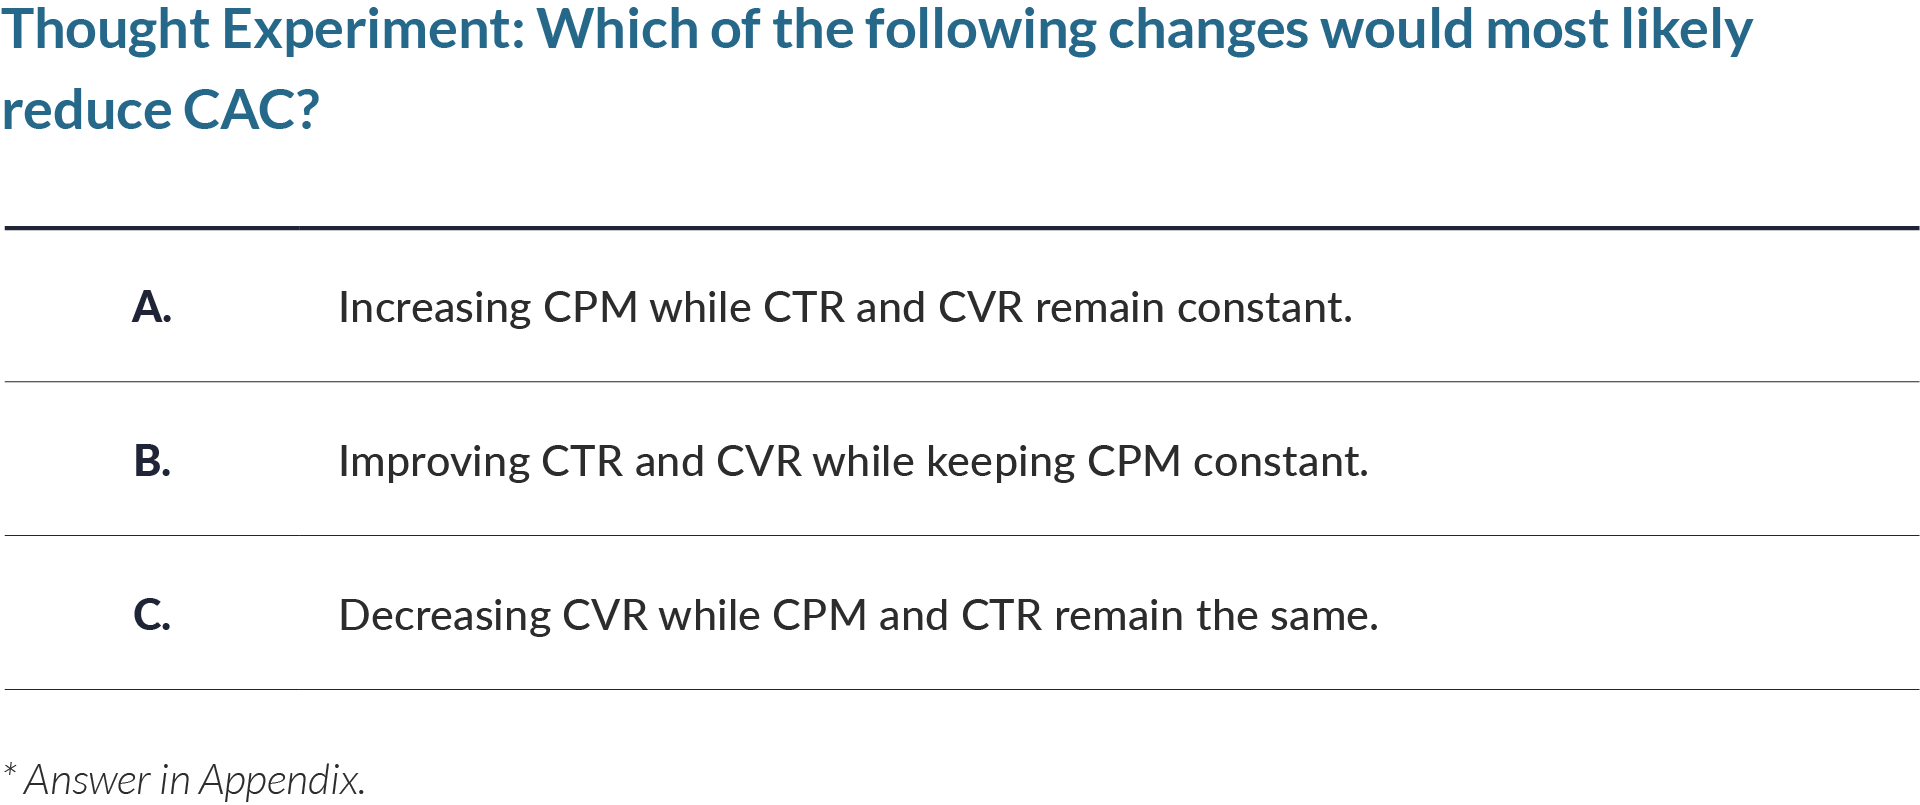
Which of the following changes would most likely reduce your CAC?
Options:
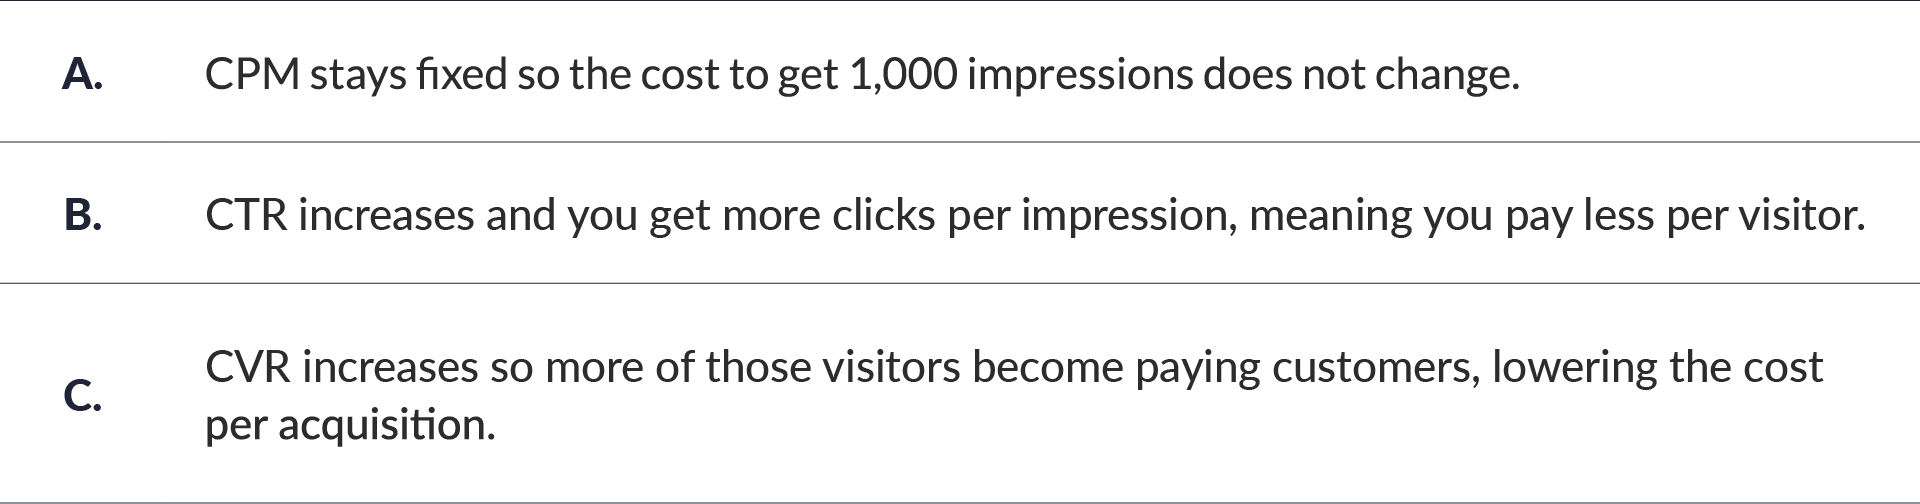
Answer:
B, improving CTR and CVR while keeping CPM constant is correct because it directly increases the efficiency of the funnel, thereby reducing CAC.
Option A is wrong because increasing CPM raises the numerator while the denominator stays the same, therefore CAC increases. Option C is also incorrect because decreasing CVR lowers the denominator and CAC increases, even if CPM and CTR do not change.
THOUGHT EXPERIMENT 3
Customer Acquisition Cost (CAC) – B2B
Question:
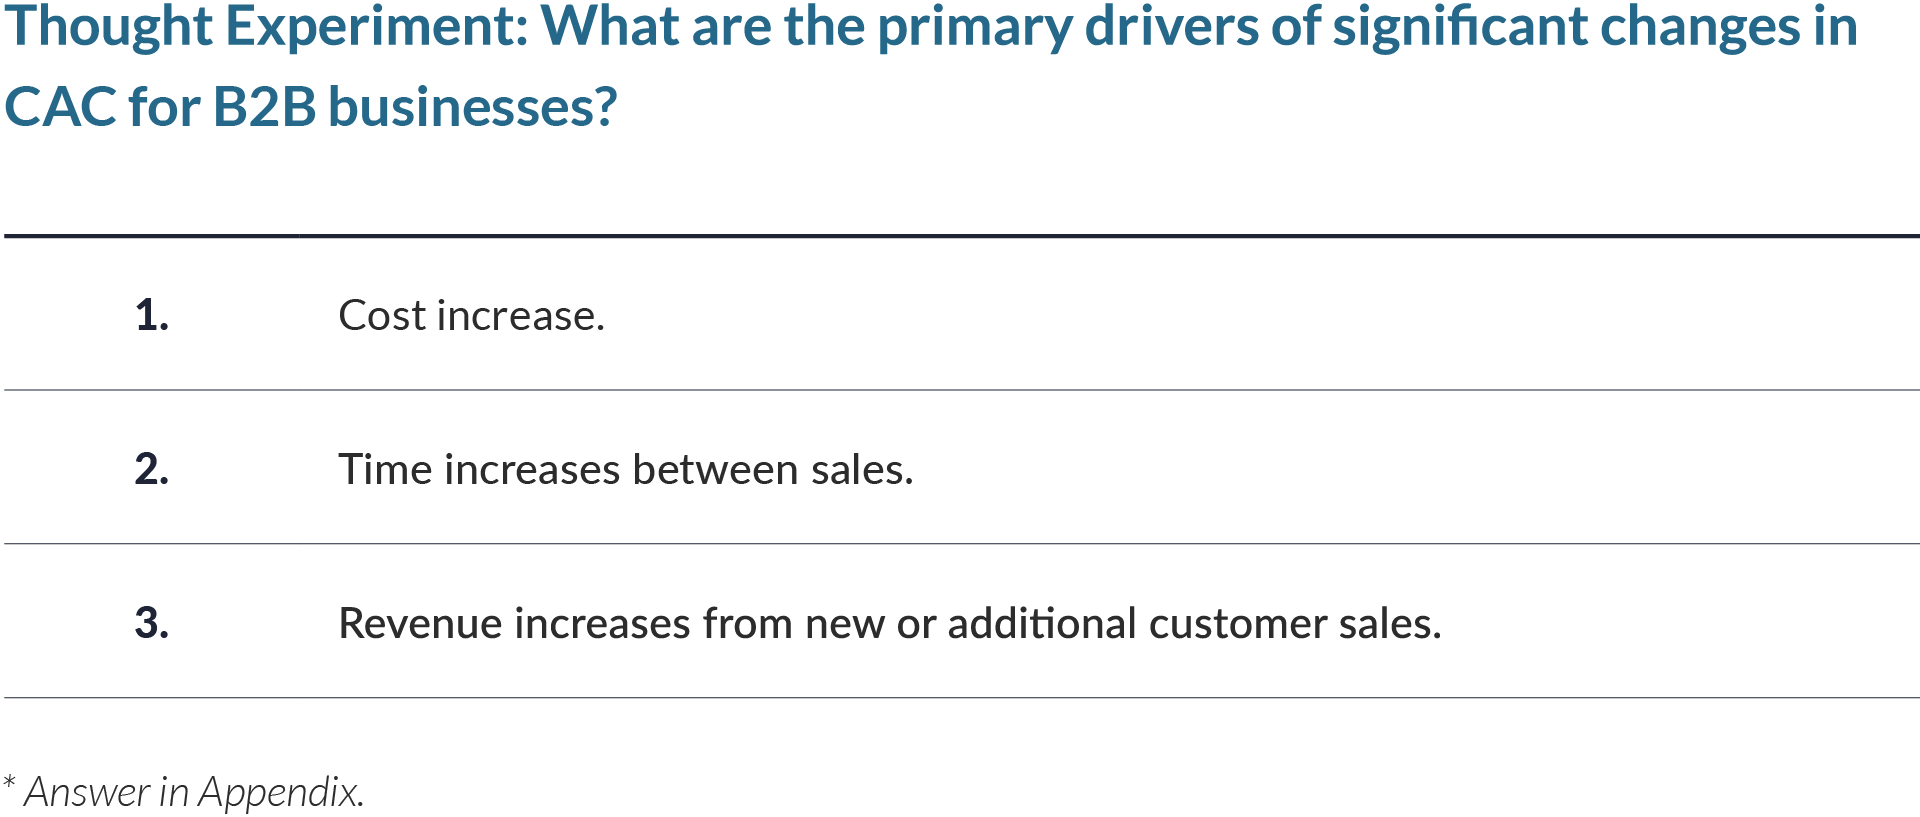
What are the primary drivers of significant changes in CAC for B2B businesses?
Options:
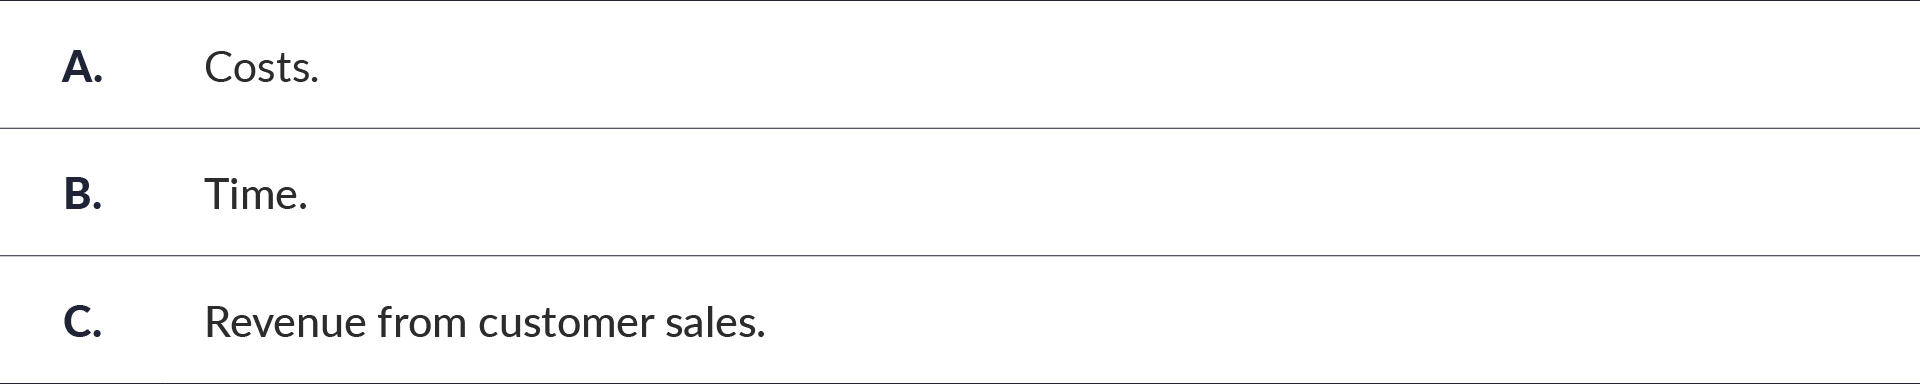
Answer:
A and B, blend of cost and time.
Time is ultimately what causes costs to accrue and threaten the profitability of a customer relationship. Costs need to be layered intentionally throughout the sales process to avoid overspending too soon before a sale is made.
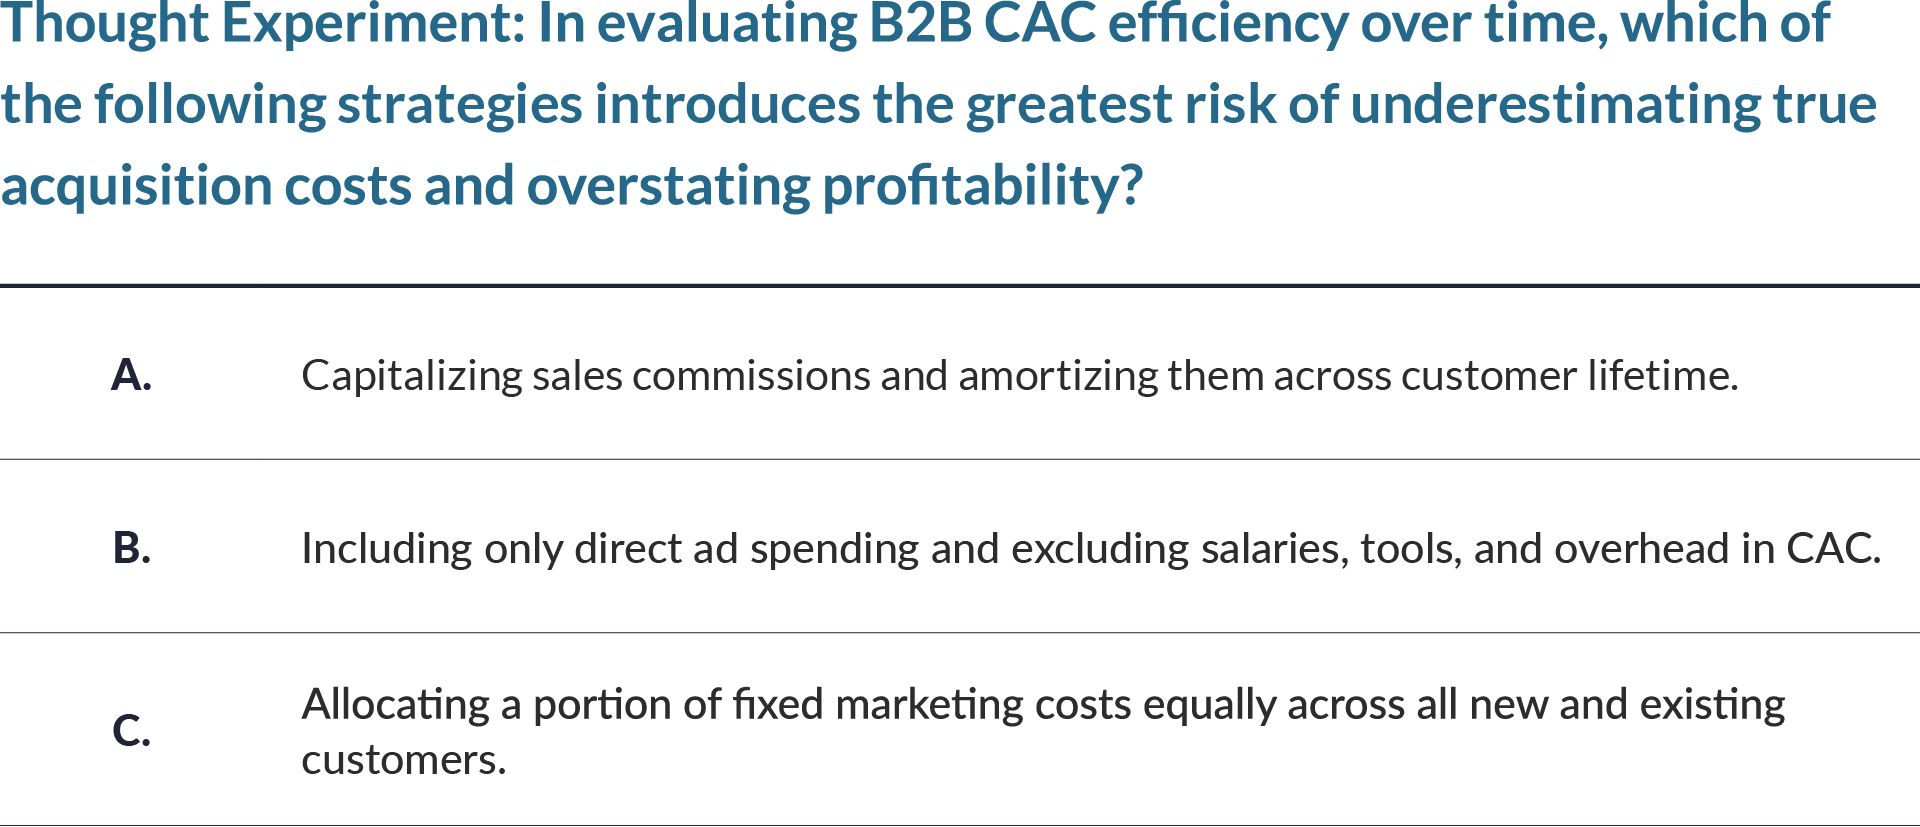
THOUGHT EXPERIMENT 4
Evaluating CAC Efficiency in B2B
Question:
Which of the following strategies introduces the greatest risk of underestimating true acquisition costs and overstating profitability?
Options:
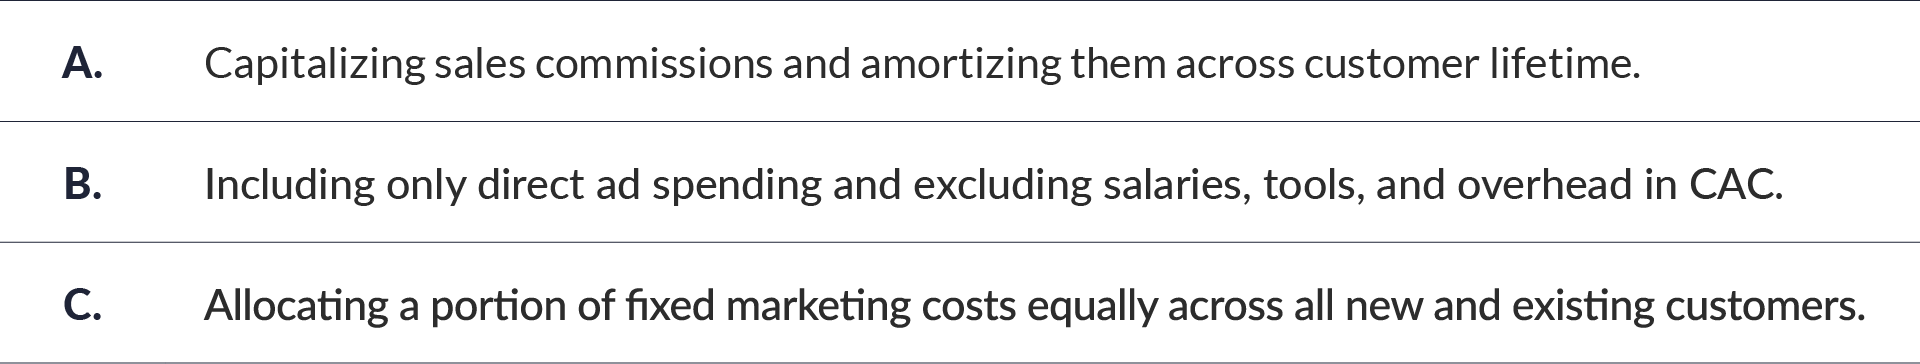
Answer:
B. Including only direct ad spending and excluding salaries, tools, and overhead in CAC.
Option B is the most likely to introduce the greatest risk of underestimating acquisition costs and overstating profitability because capitalizing commissions is common in SaaS and can align with revenue recognition; while not always ideal, it does not necessarily distort CAC if done transparently.
Excluding indirect costs such as personnel, software tools, and infrastructure grossly understates CAC, especially in B2B where deal nurturing is resource intensive.
While allocating fixed costs broadly may dilute precision, it does not create as significant a distortion as ignoring the entire cost categories.