Supply Chain Technology and Systems Integration Sector M&A Transactions and Valuations

The supply chain technology and systems integration sector is evolving rapidly as companies adopt automation, AI-driven supply chain management and digital integration solutions to enhance efficiency, resilience, and end-to-end visibility. Businesses are implementing 4PL capabilities, advanced data analytics, and cloud-based platforms to optimize procurement, inventory management, and real-time decision-making. The shift toward technology-enabled supply chain orchestration, intelligent demand forecasting, and end-to-end digital transformation is driving consolidation and investment across the sector.
This report examines M&A transaction trends, valuation metrics, and regional investment activity from Q1 2020 to Q4 2024, analyzing how capital deployment, industry consolidation, and strategic acquisitions have shaped the market. It explores major transactions, including AD Ports Group’s acquisition of Noatum Logistics, GXO Logistics’ buyout of Wincanton, and GLP’s leveraged buyout of Li & Fung. The analysis assesses the strategic rationale behind these deals, valuation multiples, and market impact, providing insights into how investors are positioning themselves in an increasingly digital and integrated supply chain ecosystem.
Additionally, the report reviews valuation trends, including EV/revenue and EV/EBITDA multiples, to identify pricing patterns and investment dynamics. It offers investors, financial advisors, corporate executives, and supply chain leaders a comprehensive understanding of the shifting competitive landscape, emerging investment opportunities, and the strategic direction of global supply chain technology and systems integration businesses.


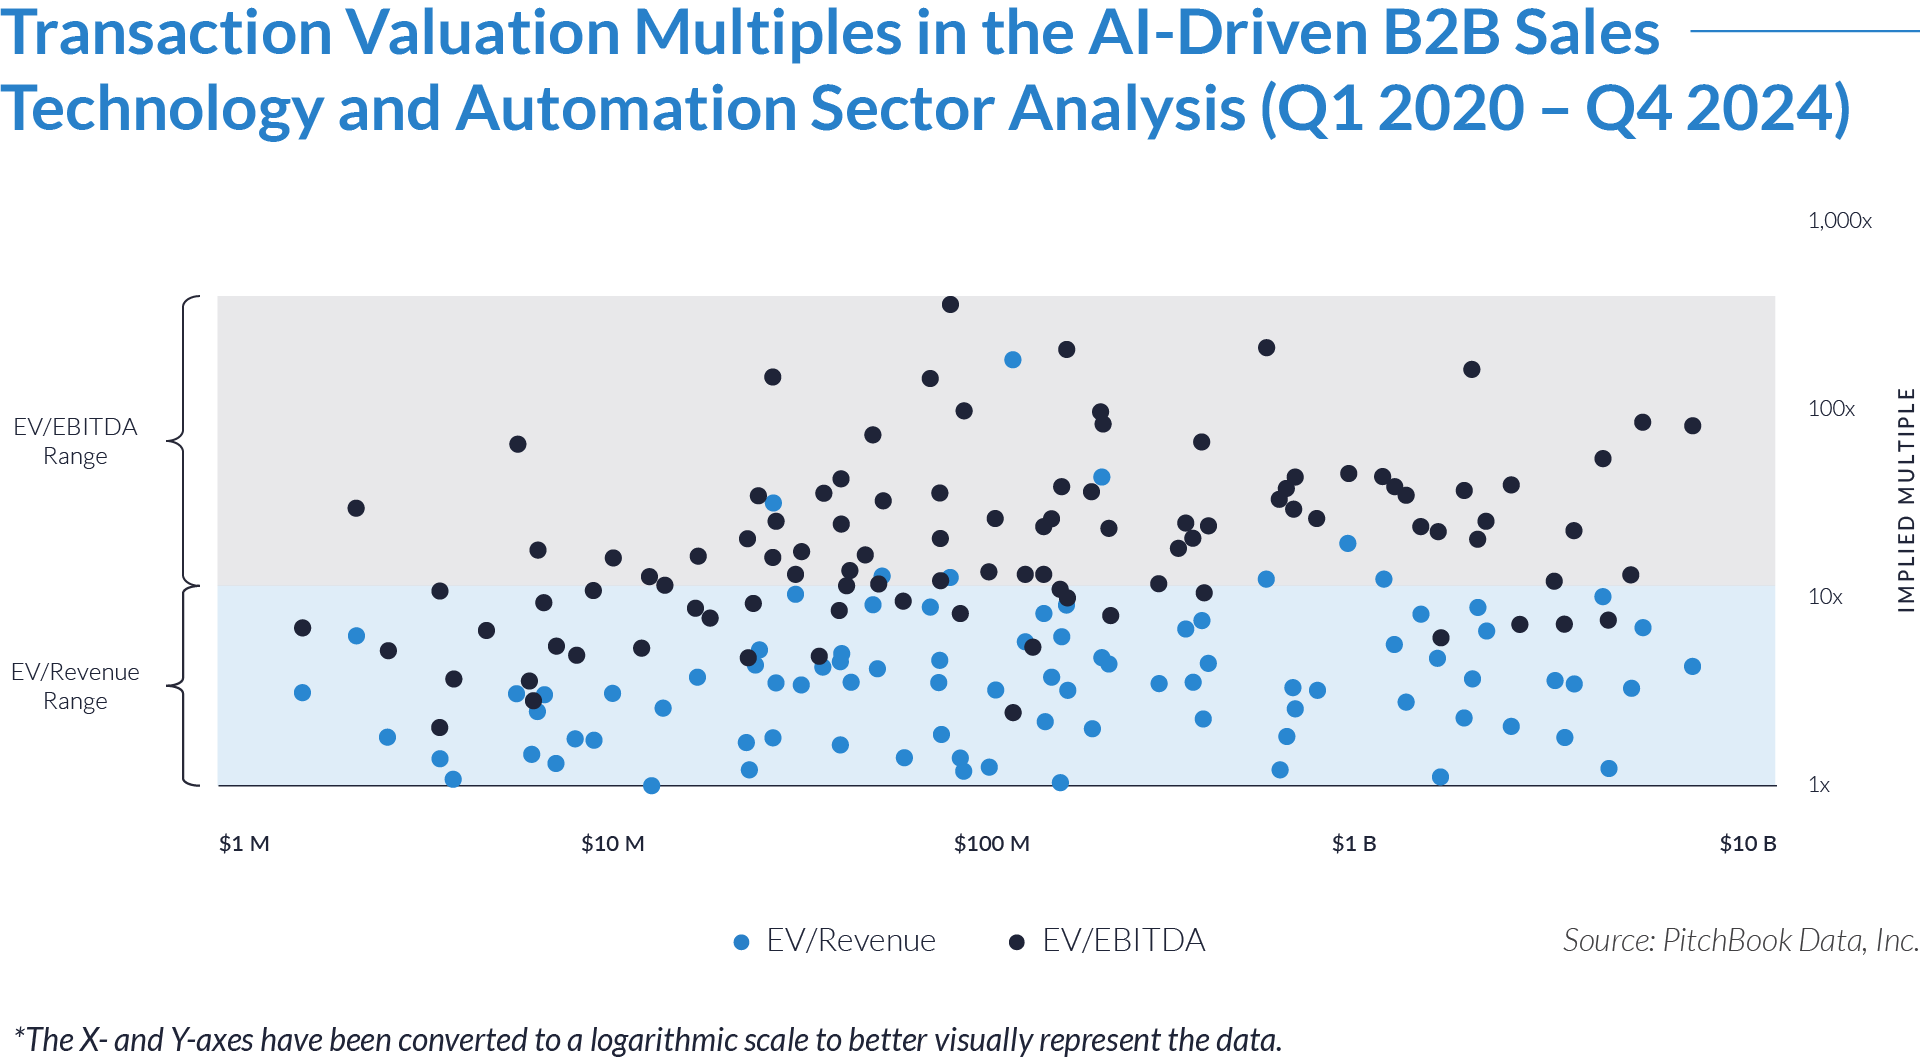
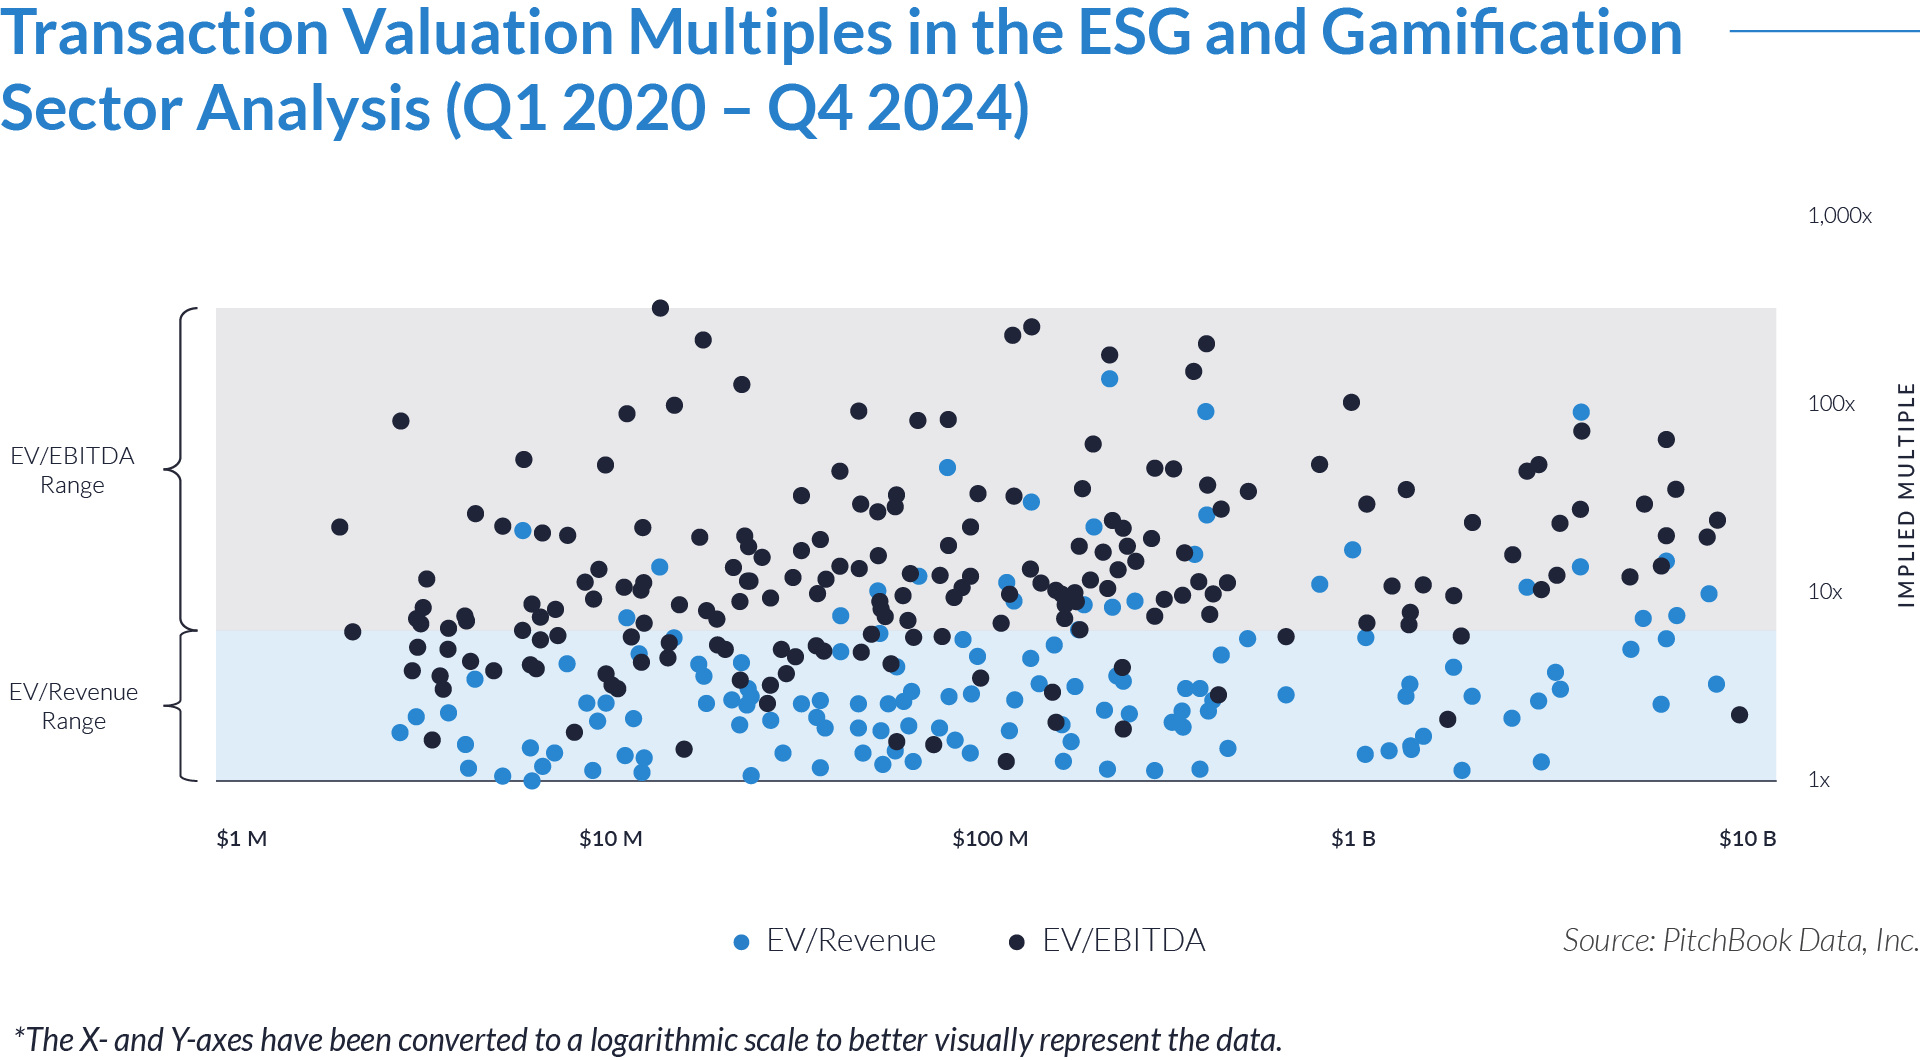
- Valuation multiples are based on a sample set of M&A transactions in the supply chain technology and systems integration sector, using data collected on February 21, 2025.
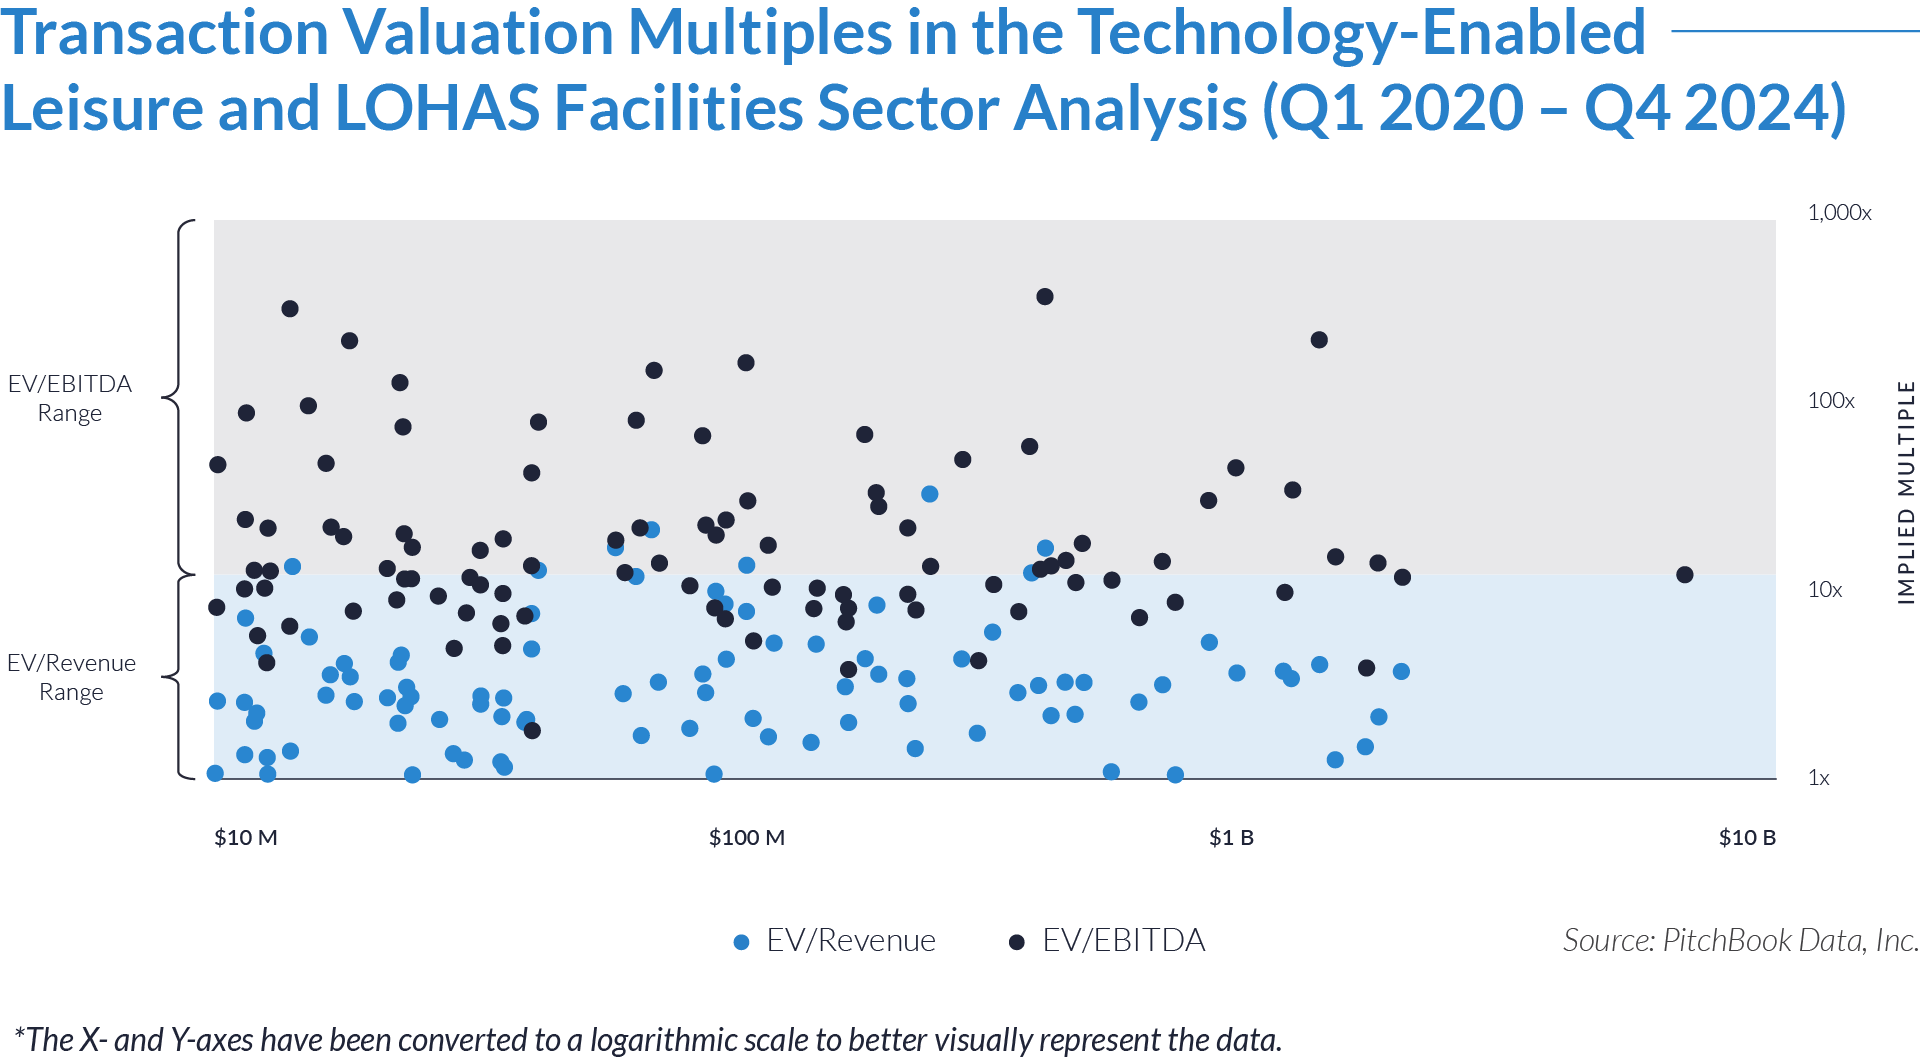
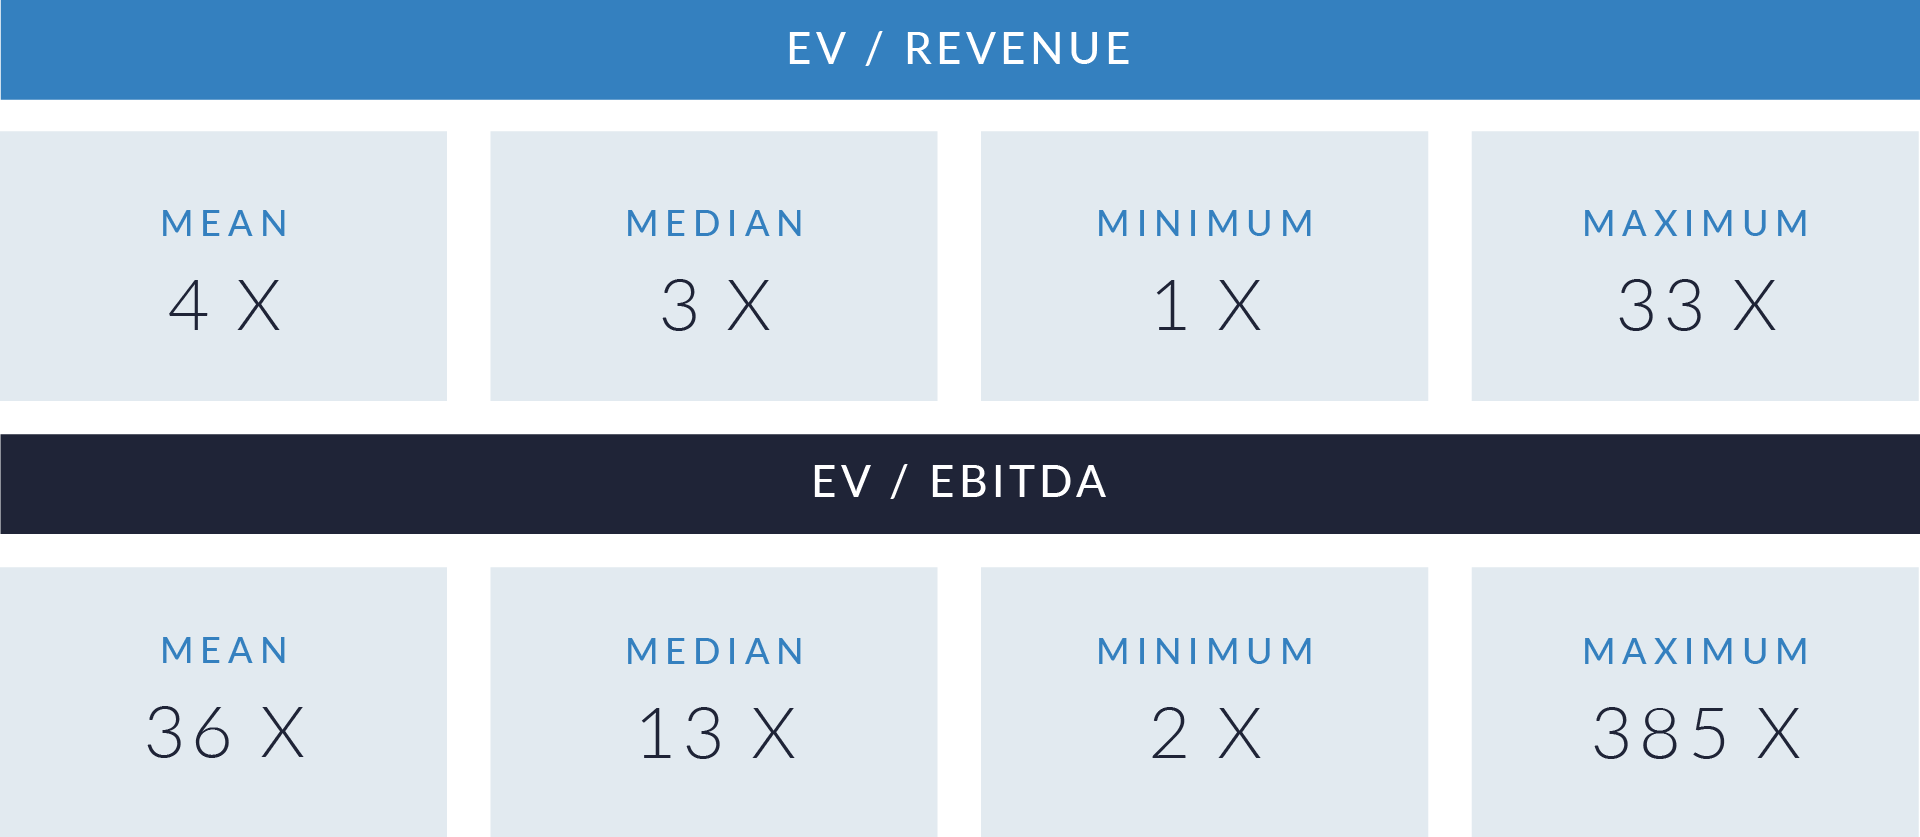
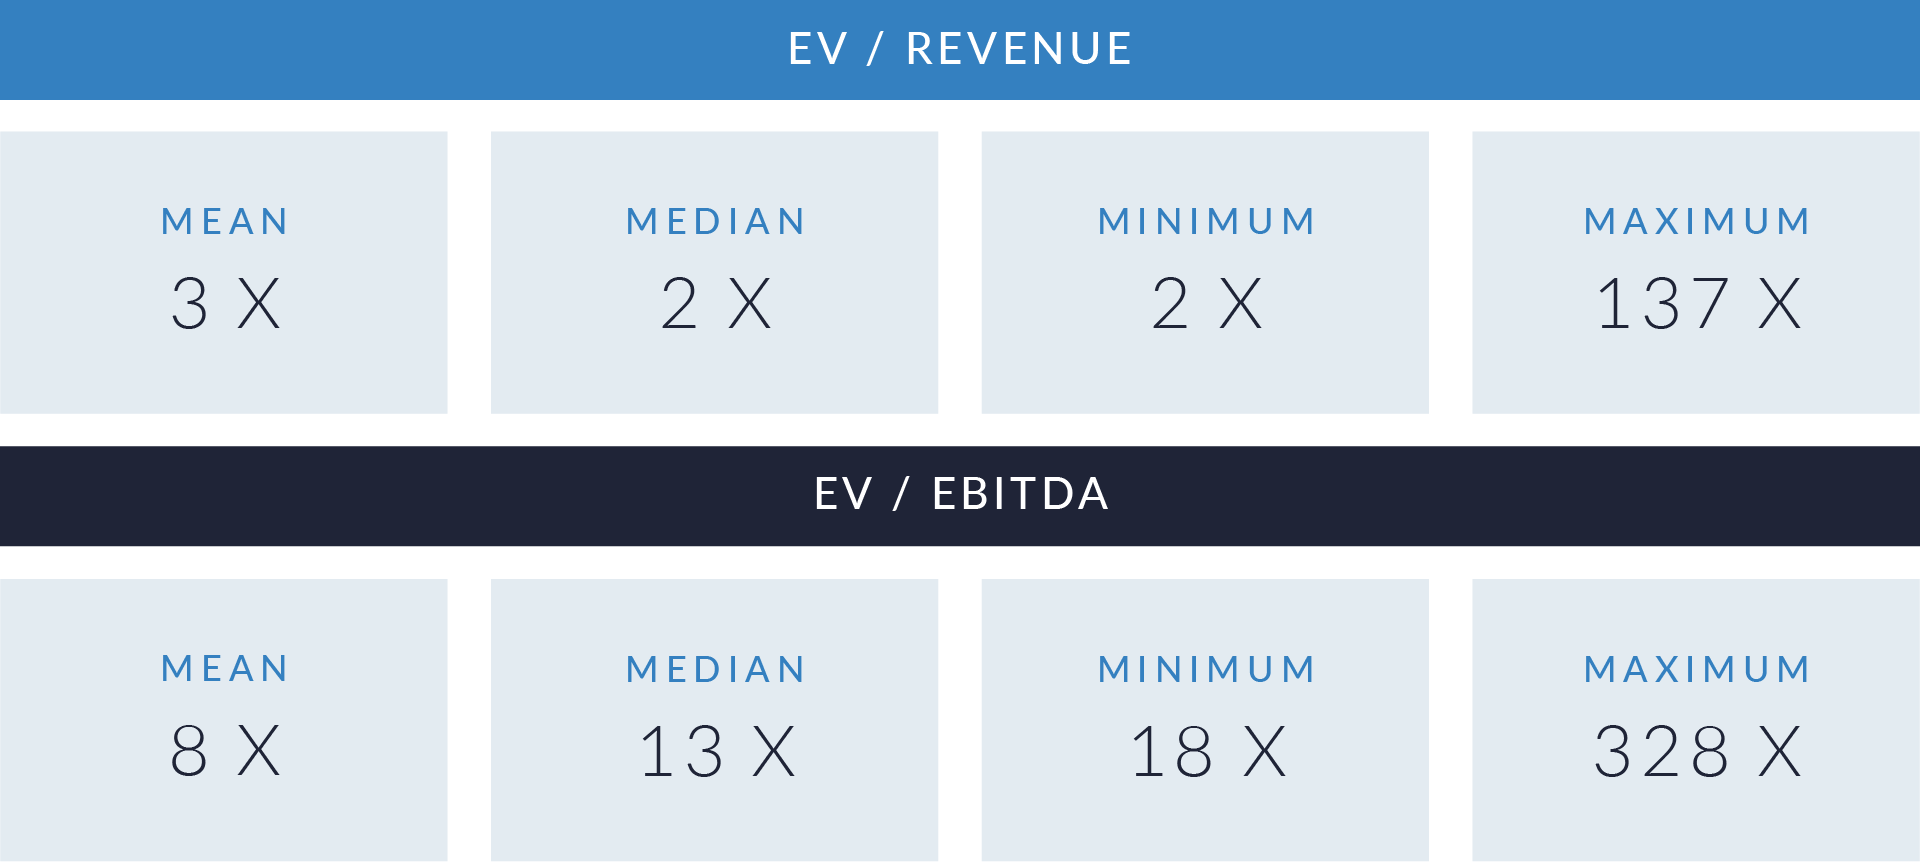
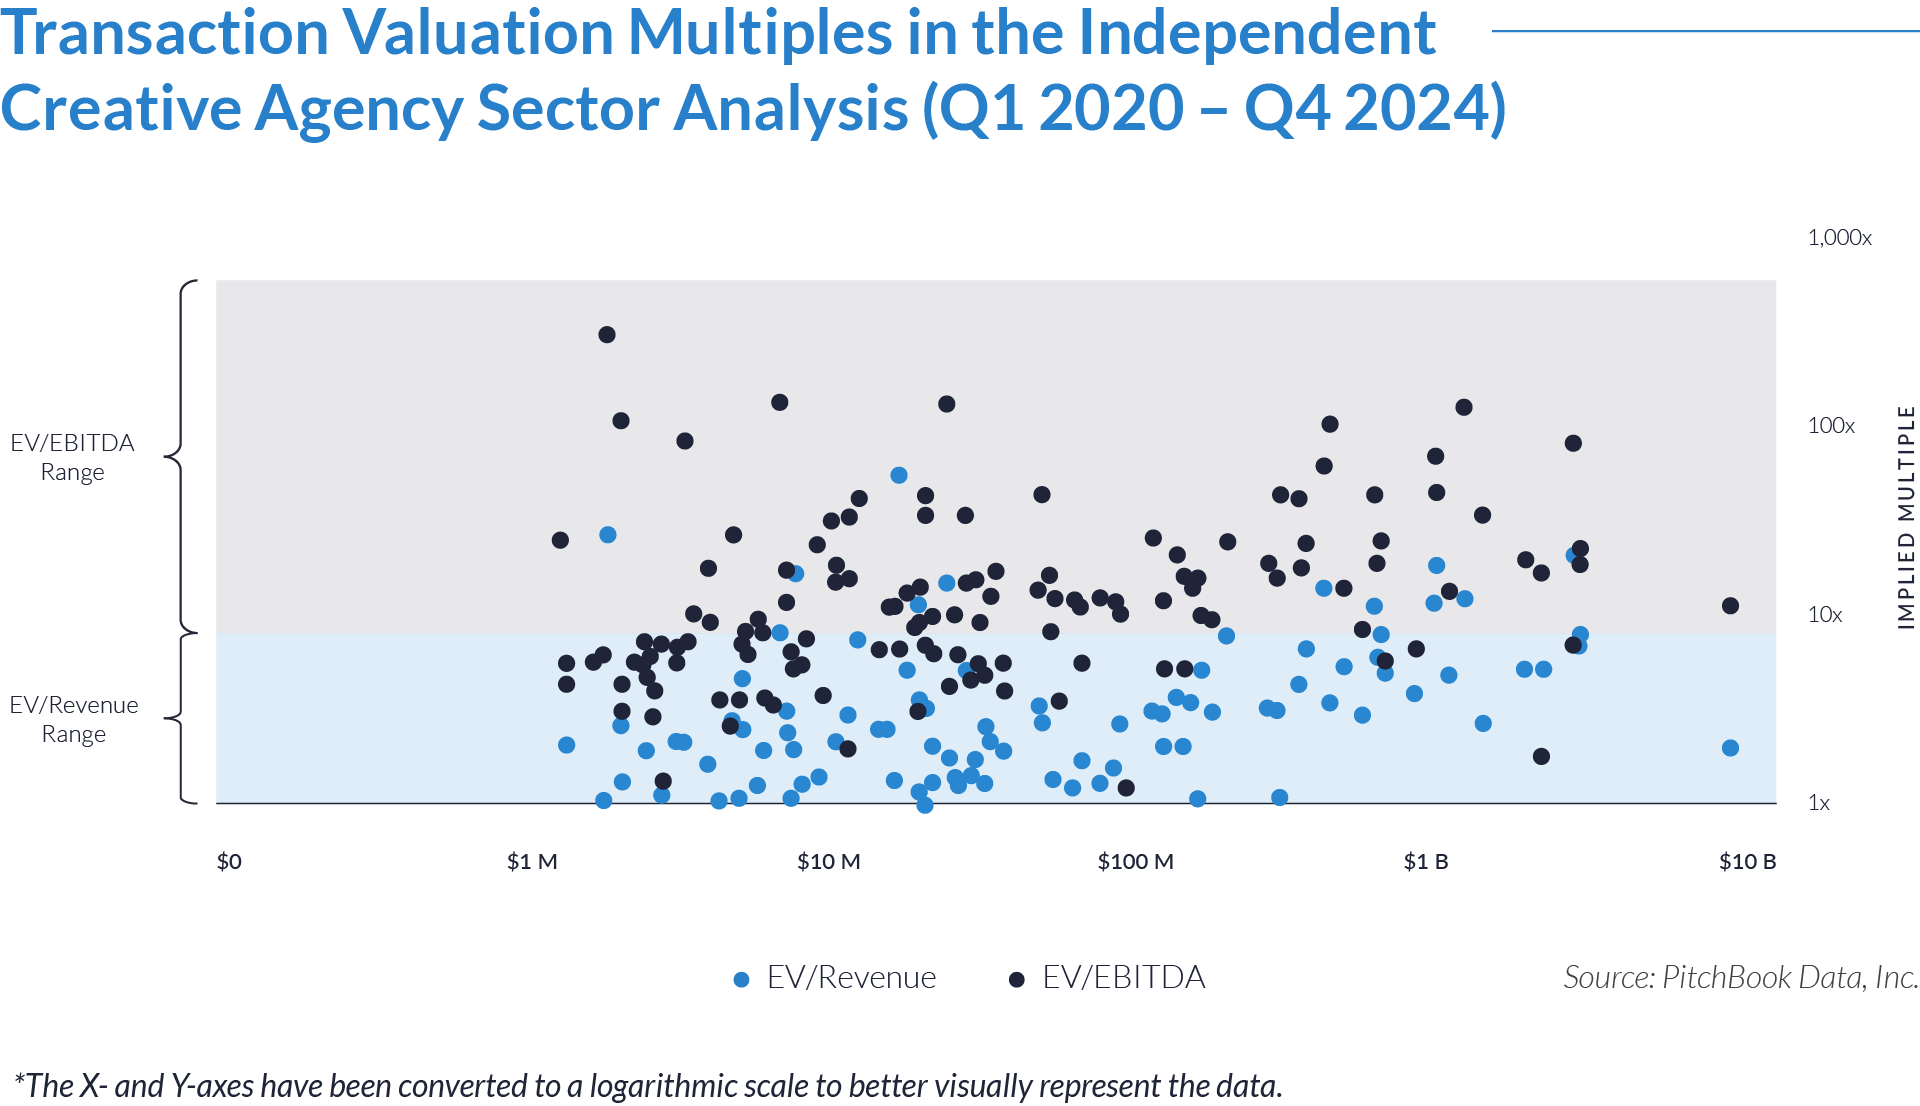
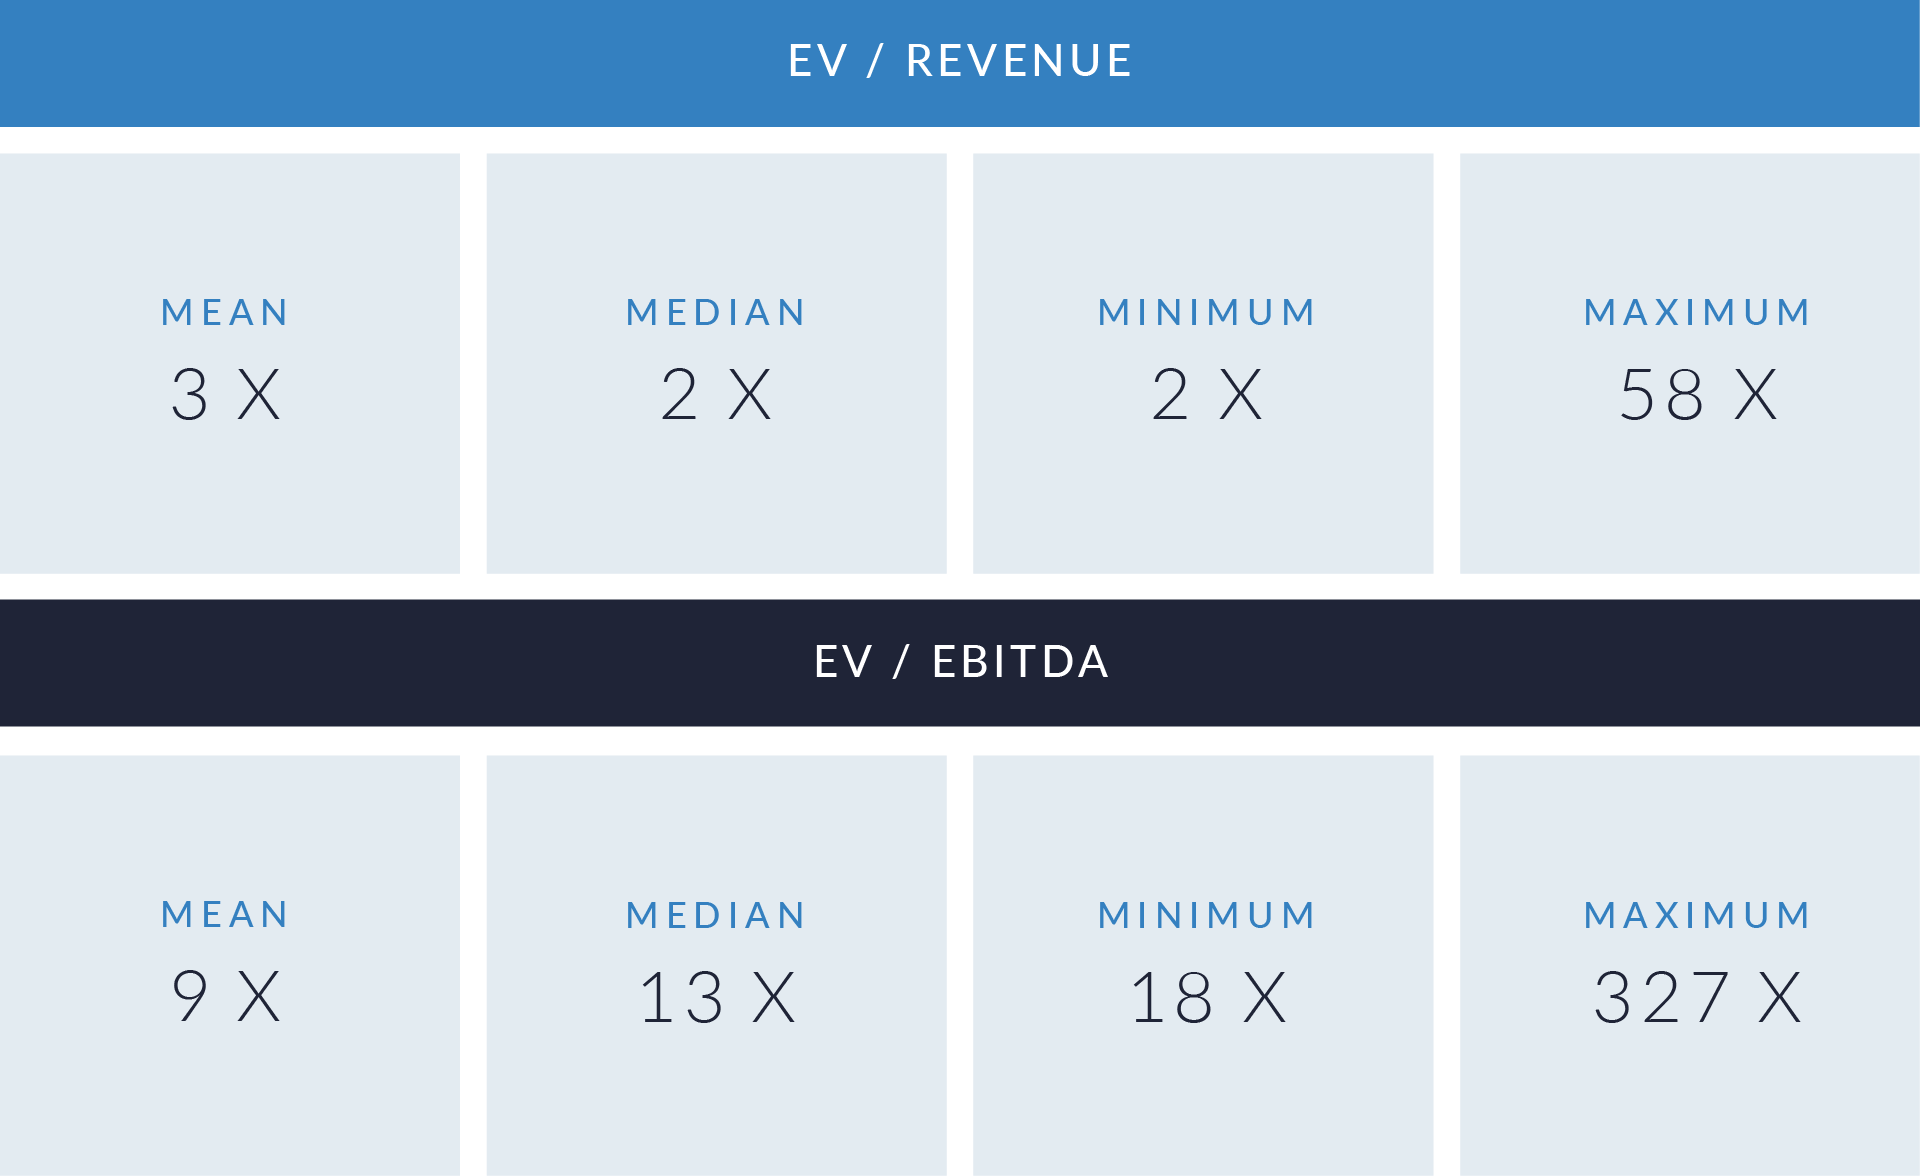
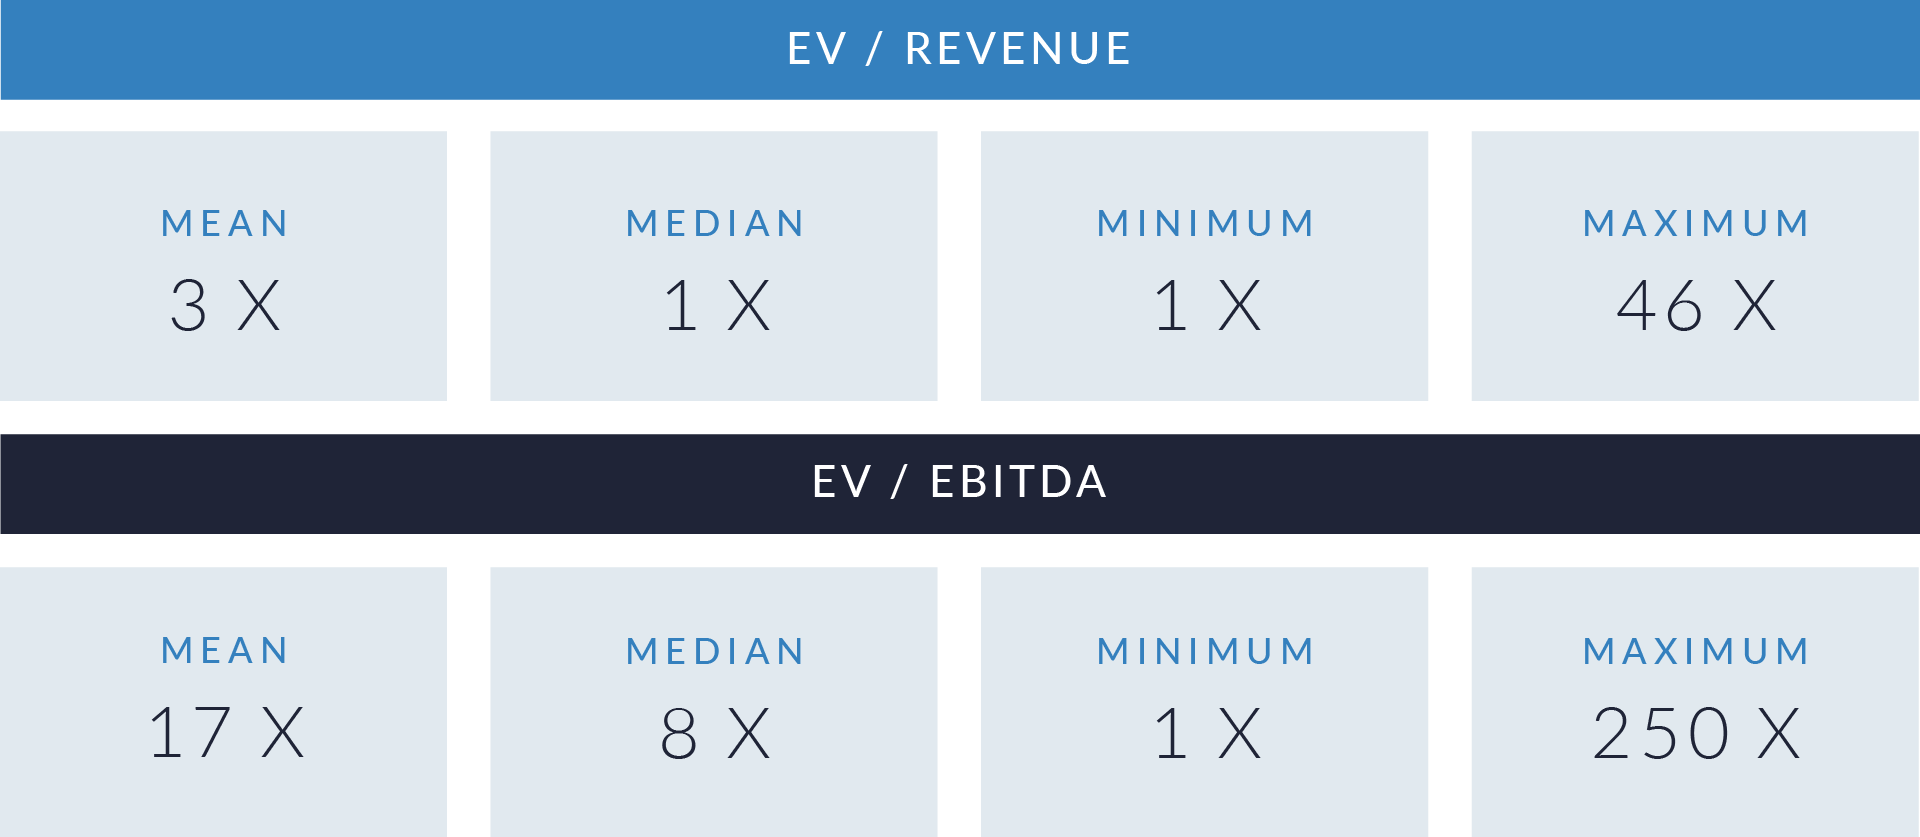
- Enterprise values range from $1 million to $8 billion, reflecting a mix of large-scale supply chain technology providers and smaller niche players. Investors assign valuations between 1x and 46x revenue, with technology-driven firms commanding the highest multiples. Traditional businesses trade at lower revenue multiples, highlighting a preference for scalable, tech-enabled solutions.
- EV/EBITDA ratios vary widely, from 1x to 230x, revealing significant differences in profitability and investor expectations. Some companies secure high valuations despite low earnings, driven by strategic positioning, digital capabilities, or strong growth potential. In contrast, more established firms trade at lower multiples, attracting value-focused investors seeking stable cash flows.
- Companies specializing in digital freight management, automation-driven 4PL, and AI-powered supply chain solutions achieve premium valuations. Investors prioritize businesses that integrate automation, data analytics, and cloud-based platforms, while asset-heavy providers face lower valuations due to capital-intensive operations.

Capital Markets Activities
The data highlights transaction trends, valuation metrics, and geographic investment patterns in the supply chain technology and systems integration sector. Rising demand for automation, AI-driven logistics, and digital supply chain visibility has fueled M&A activity and shaped investment strategies. Strategic acquisitions, private equity buyouts, and digital transformation initiatives are scaling logistics platforms and asset-light, technology-enabled business models. These trends are accelerating market consolidation, innovation, and the integration of predictive analytics, smart automation, and cloud-based solutions.

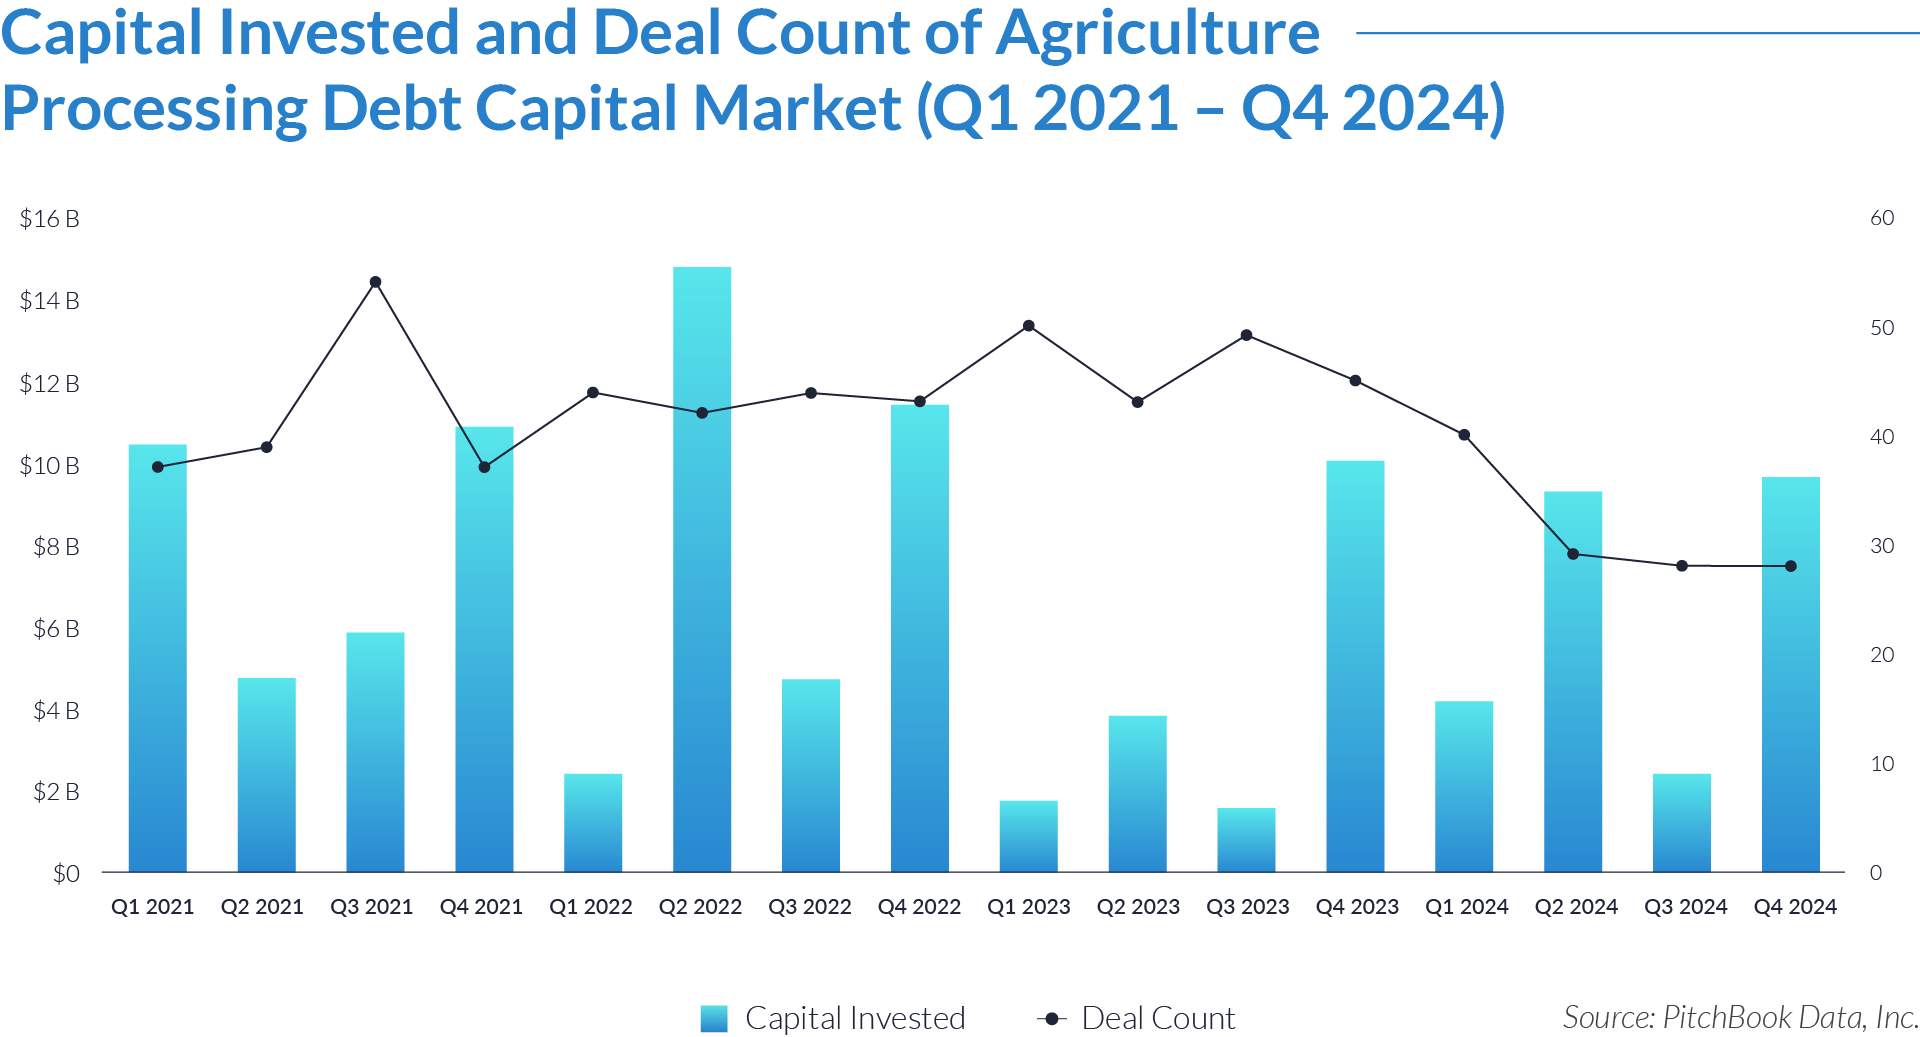
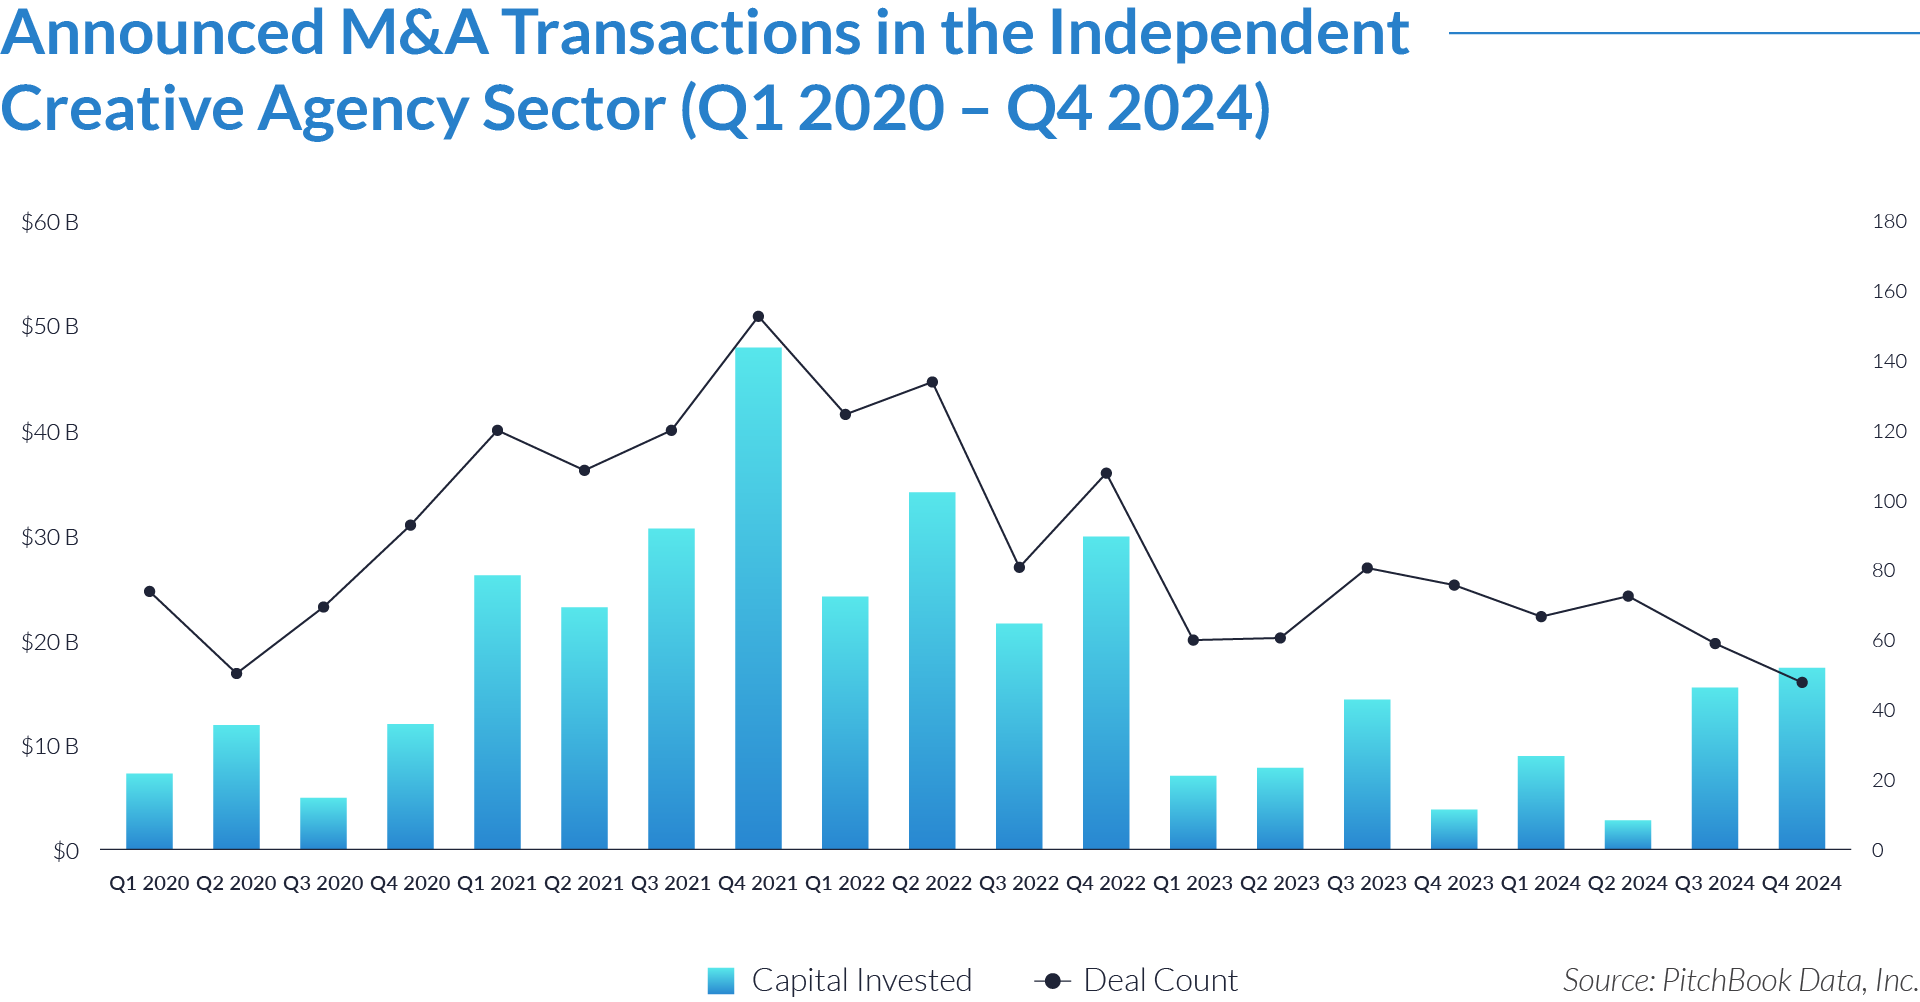
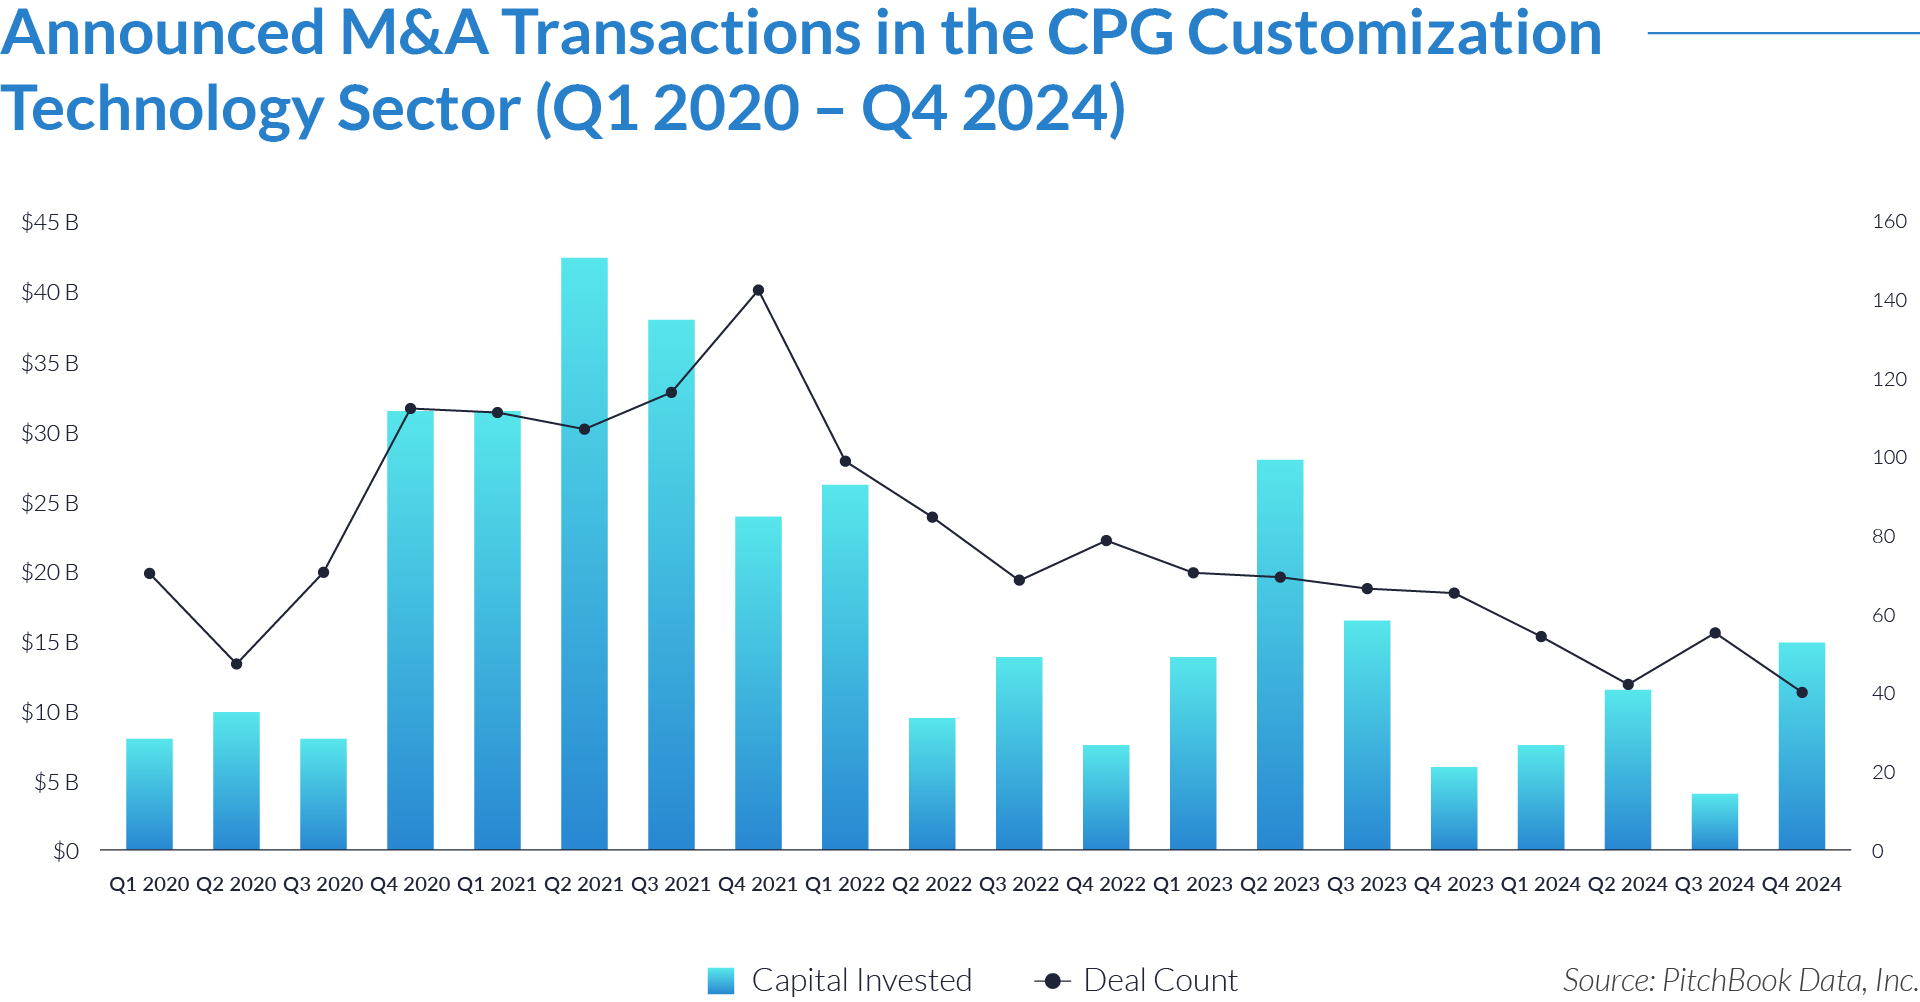
- Investors deployed $617 billion across 1,691 deals over 20 quarters, with an average deal size of $365 million, reflecting sustained interest in the sector.
- Capital investment peaked in Q3 2021 at $88 billion across 119 deals, marking the most active quarter in the dataset. This surge likely resulted from post-pandemic digital transformation, widespread supply chain disruptions, and increasing demand for automation and AI-driven logistics. Investors prioritized technologies that enhance supply chain resilience and efficiency.
- Following the 2021 peak, investment levels adjusted in 2023 and 2024, averaging just under $30 billion per quarter as the market stabilized. Investors shifted focus toward cost optimization, strategic consolidation, and long-term growth initiatives. Despite these adjustments, deal flow remained strong, highlighting confidence in the sector’s continued expansion and innovation.
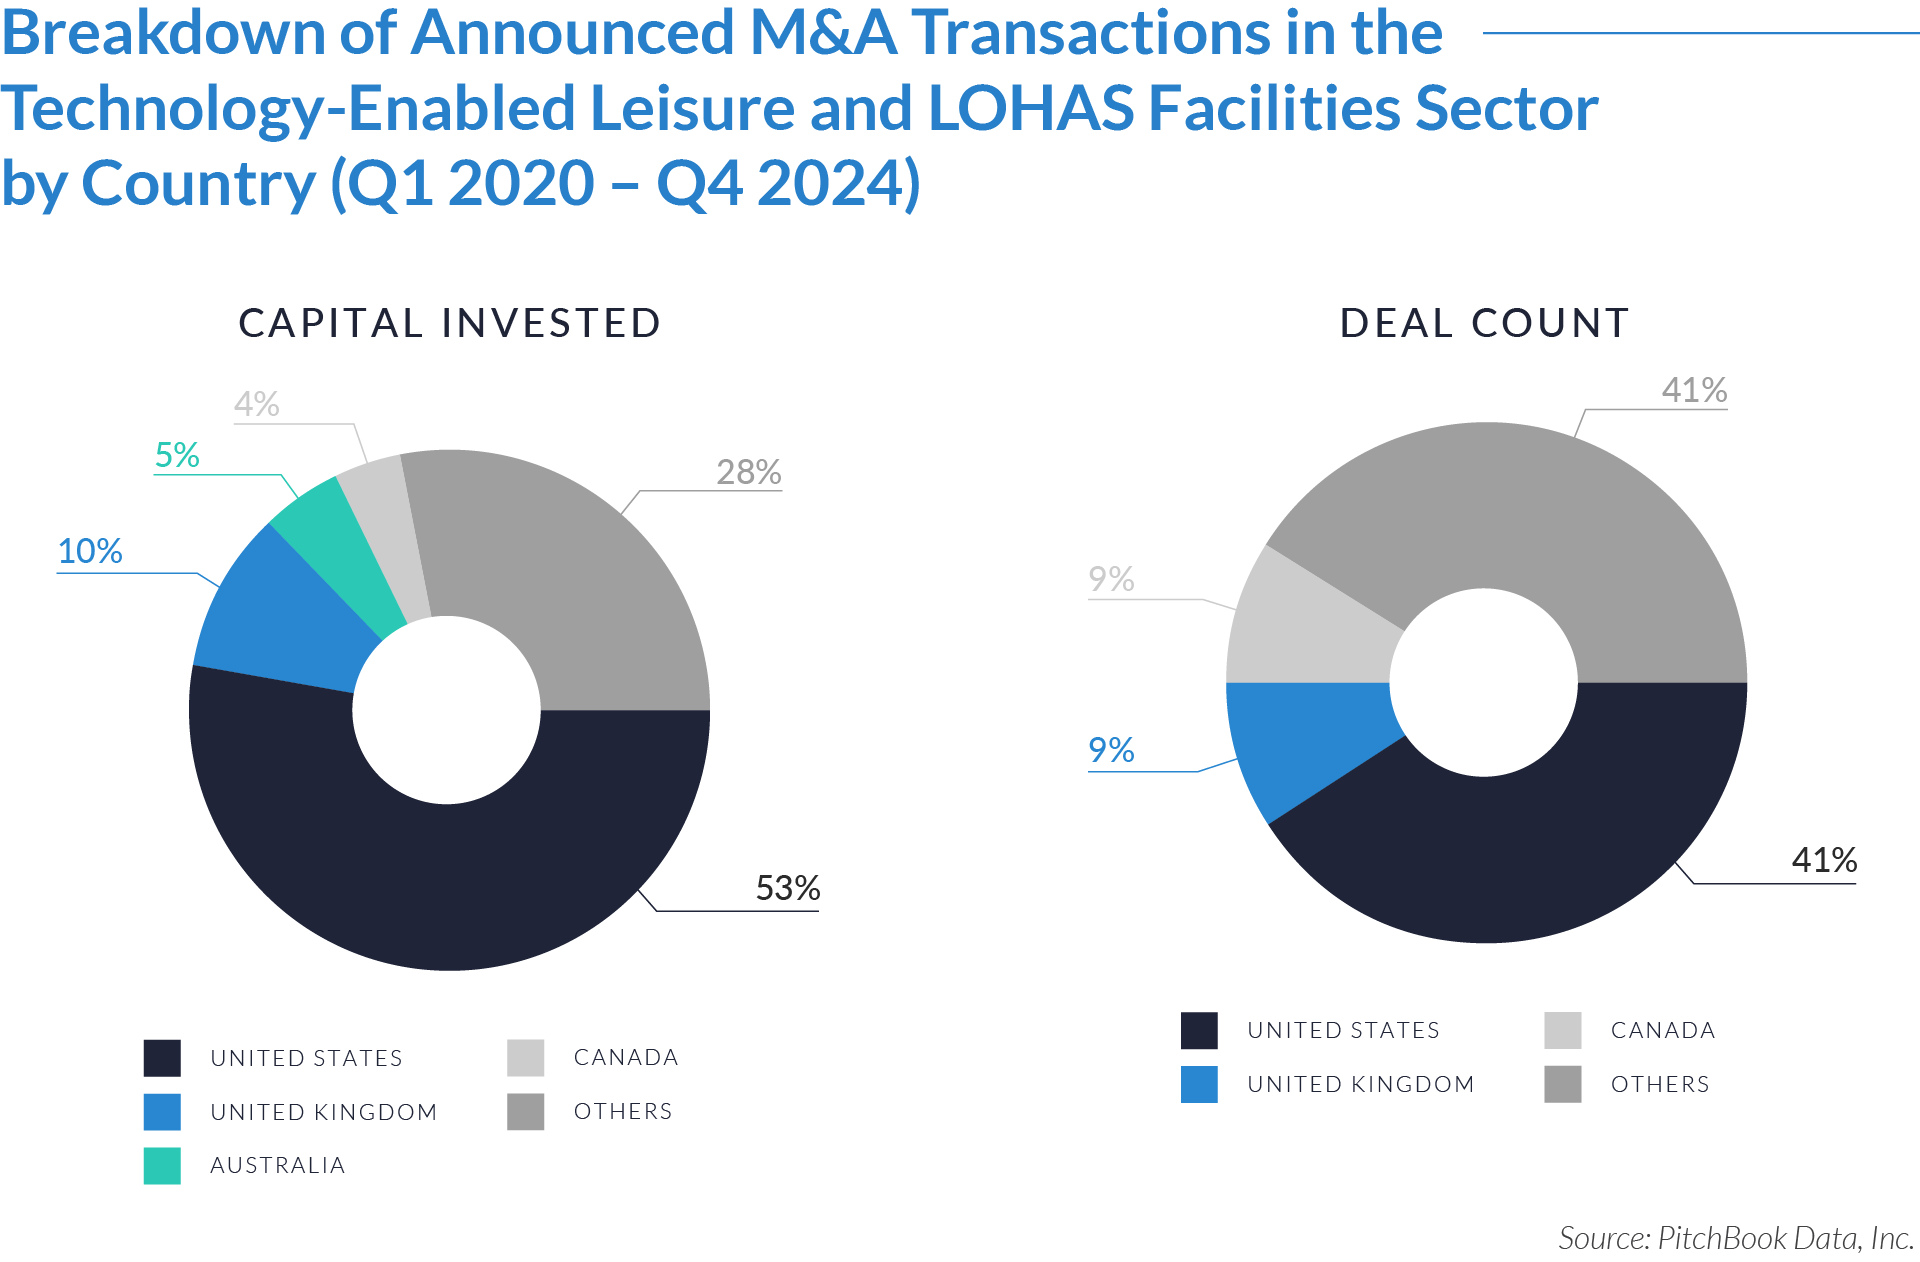
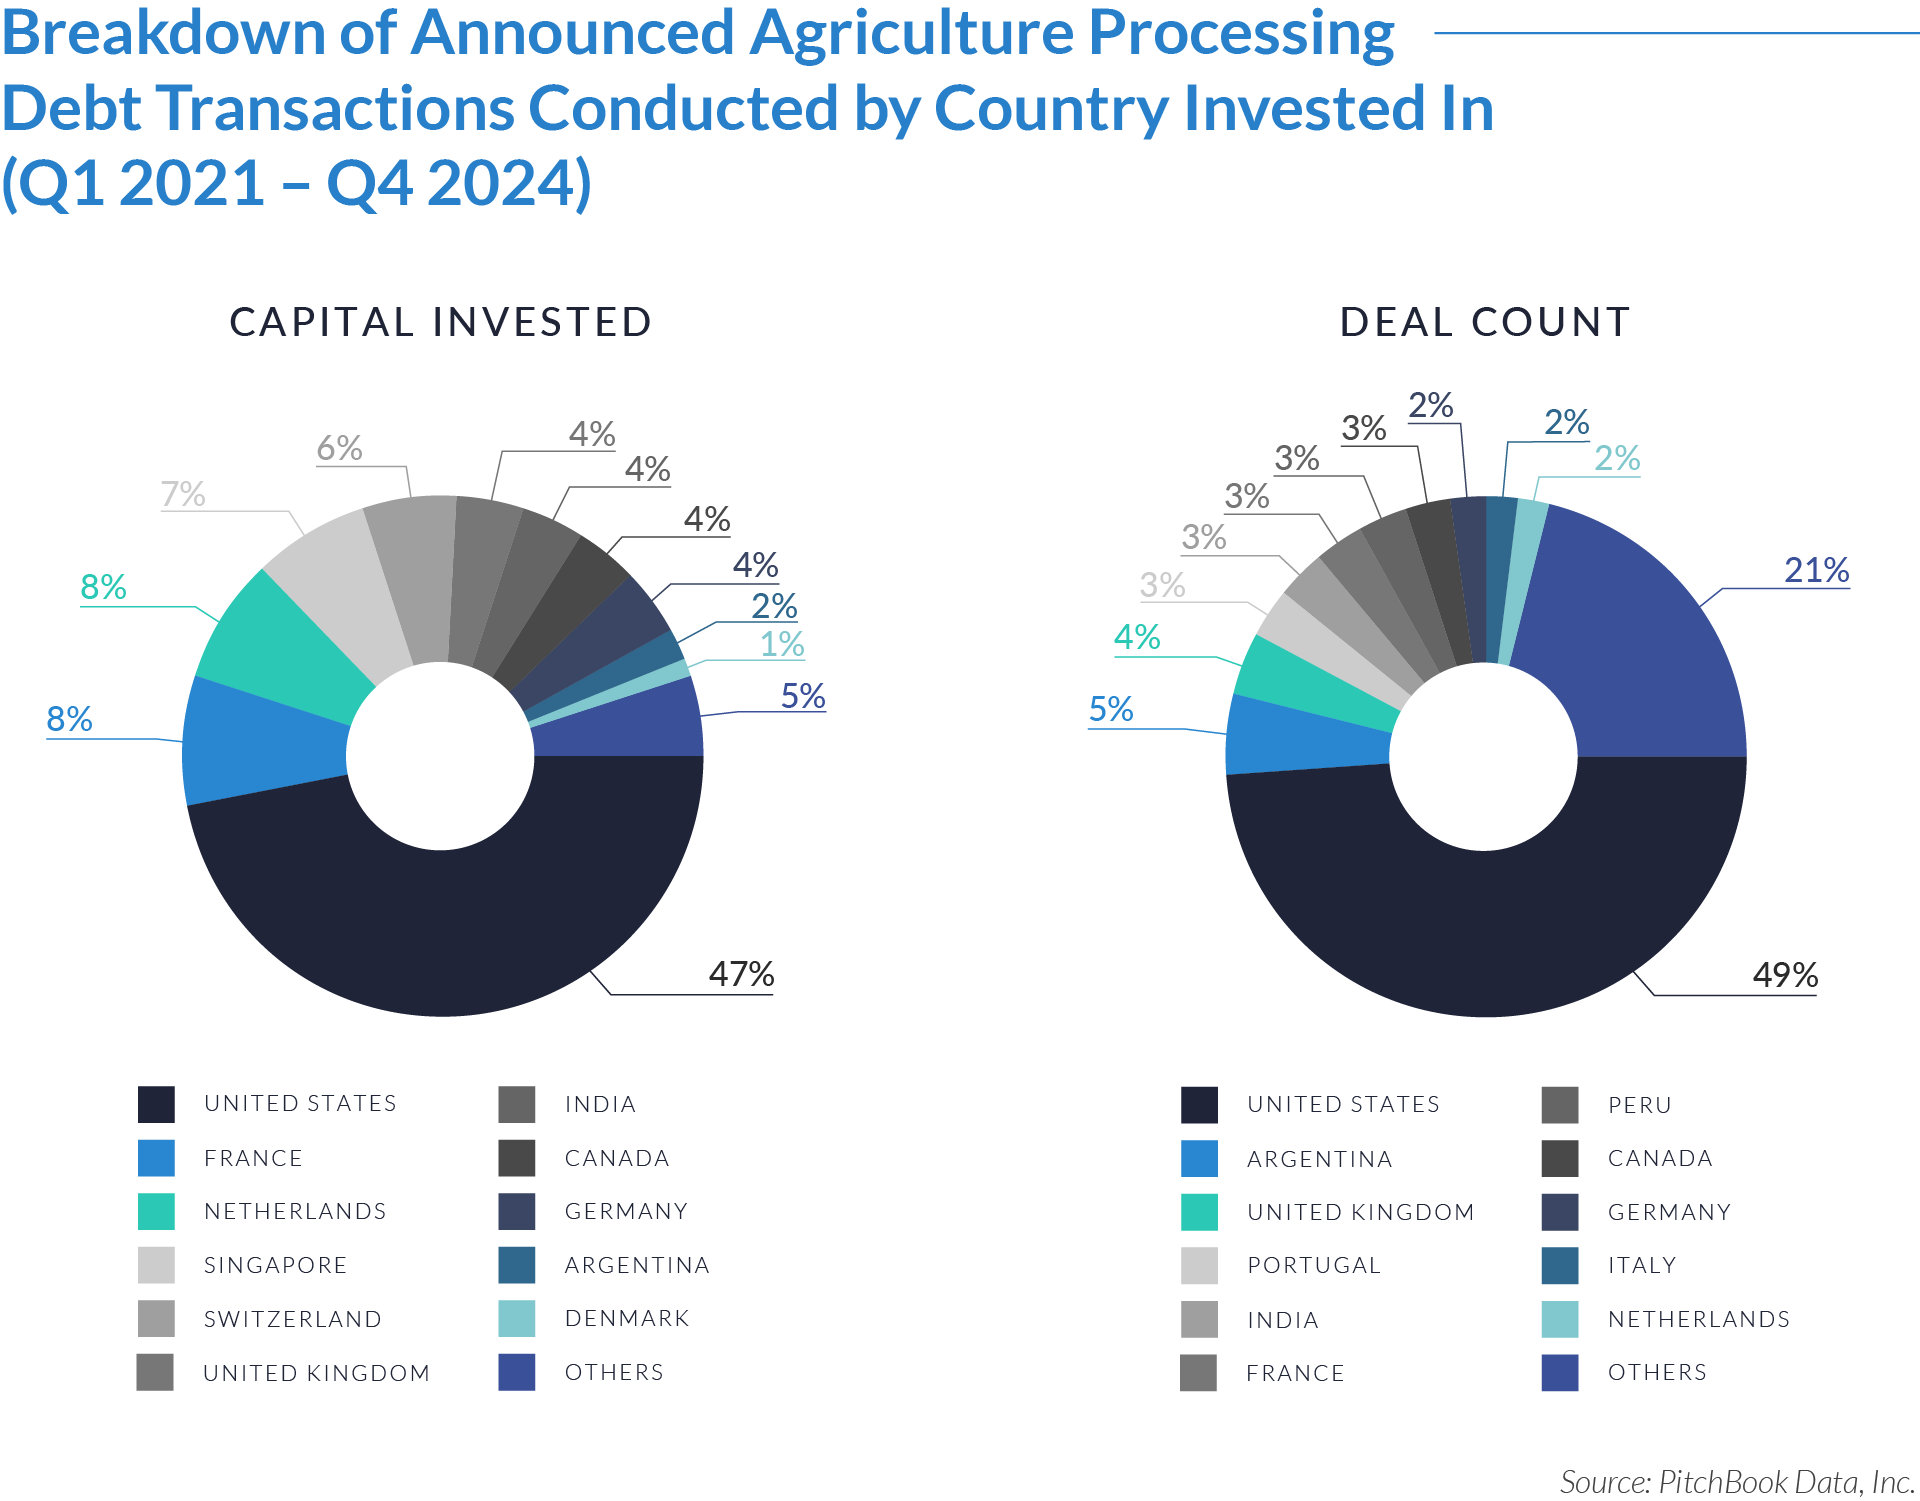
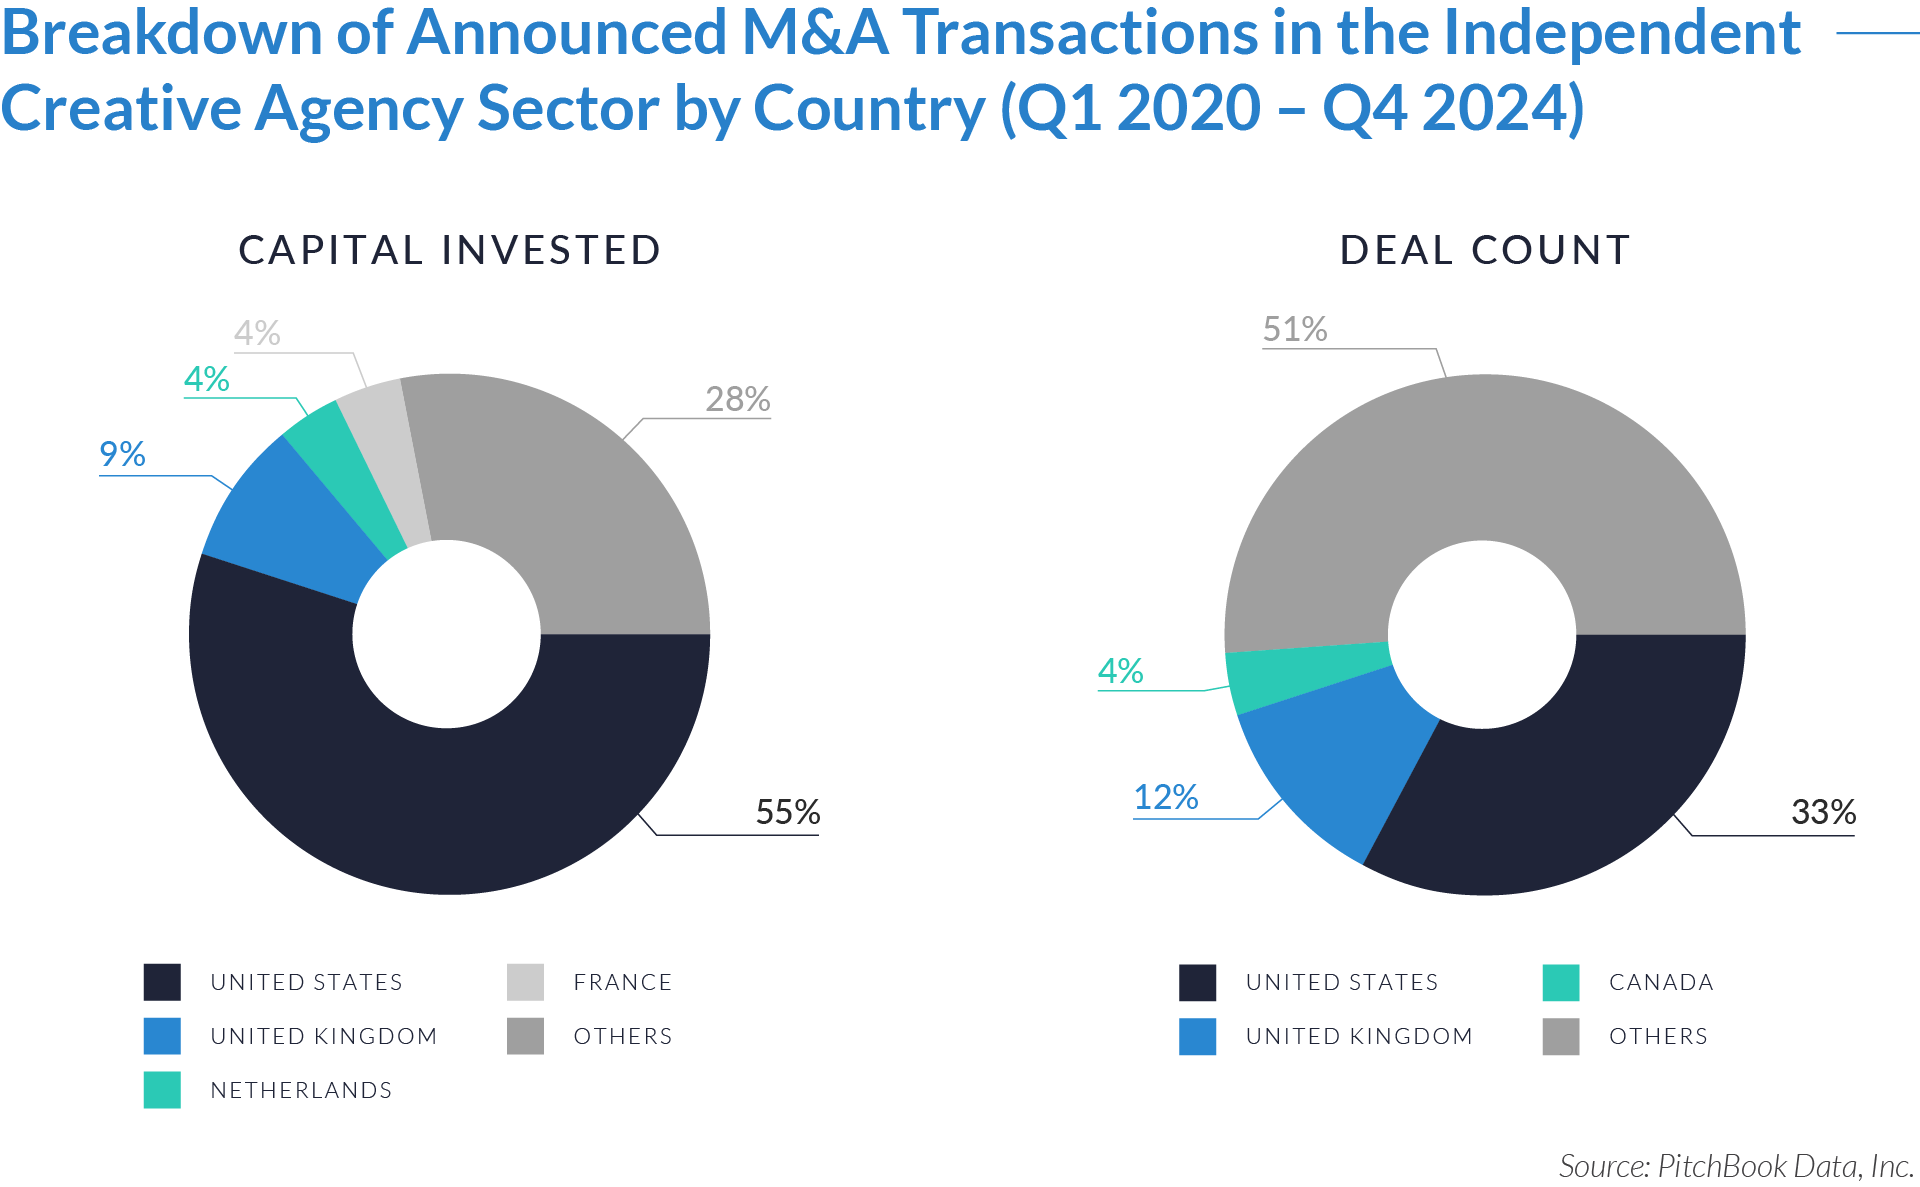
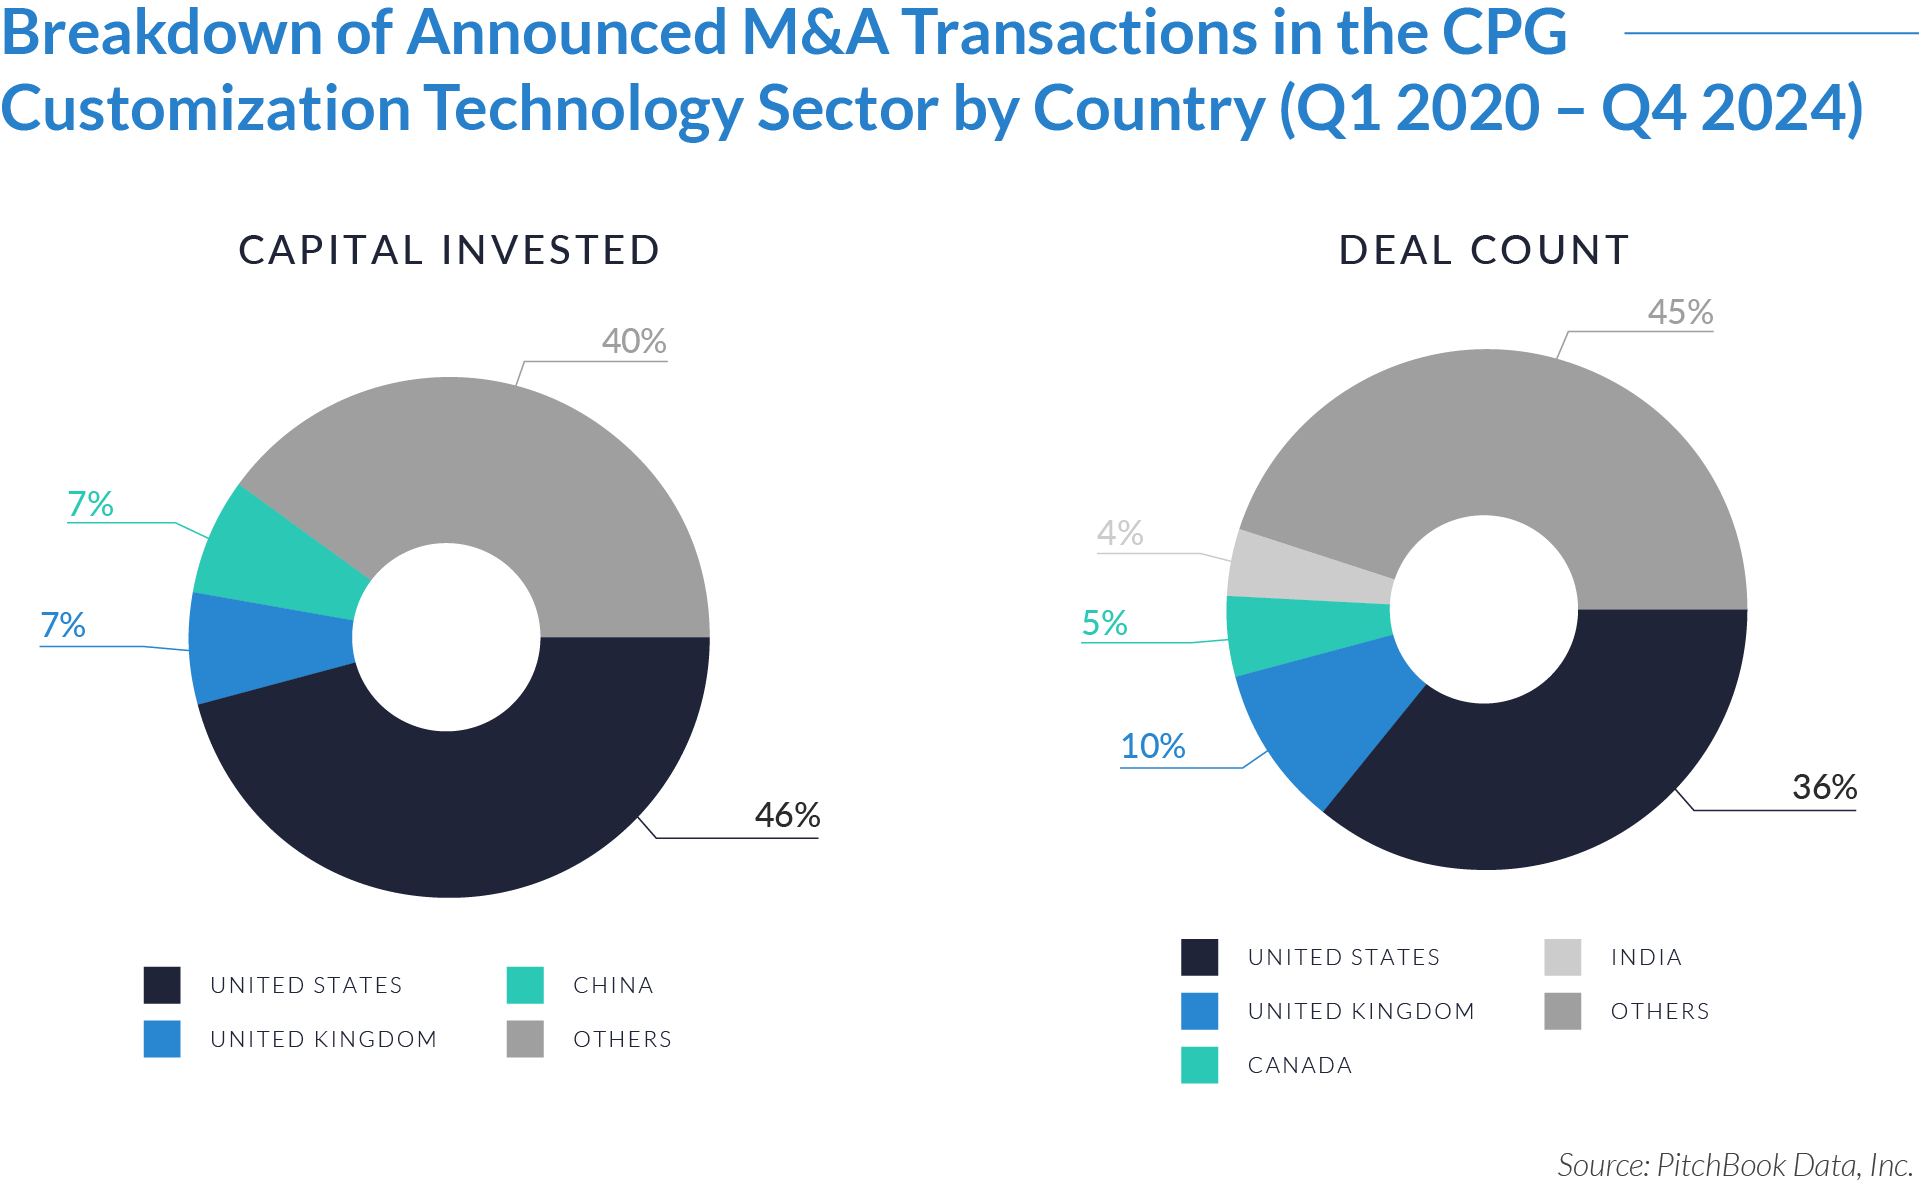
The graphs below present the geographic distribution of transactions, providing additional detail on regional trends and investment dynamics.
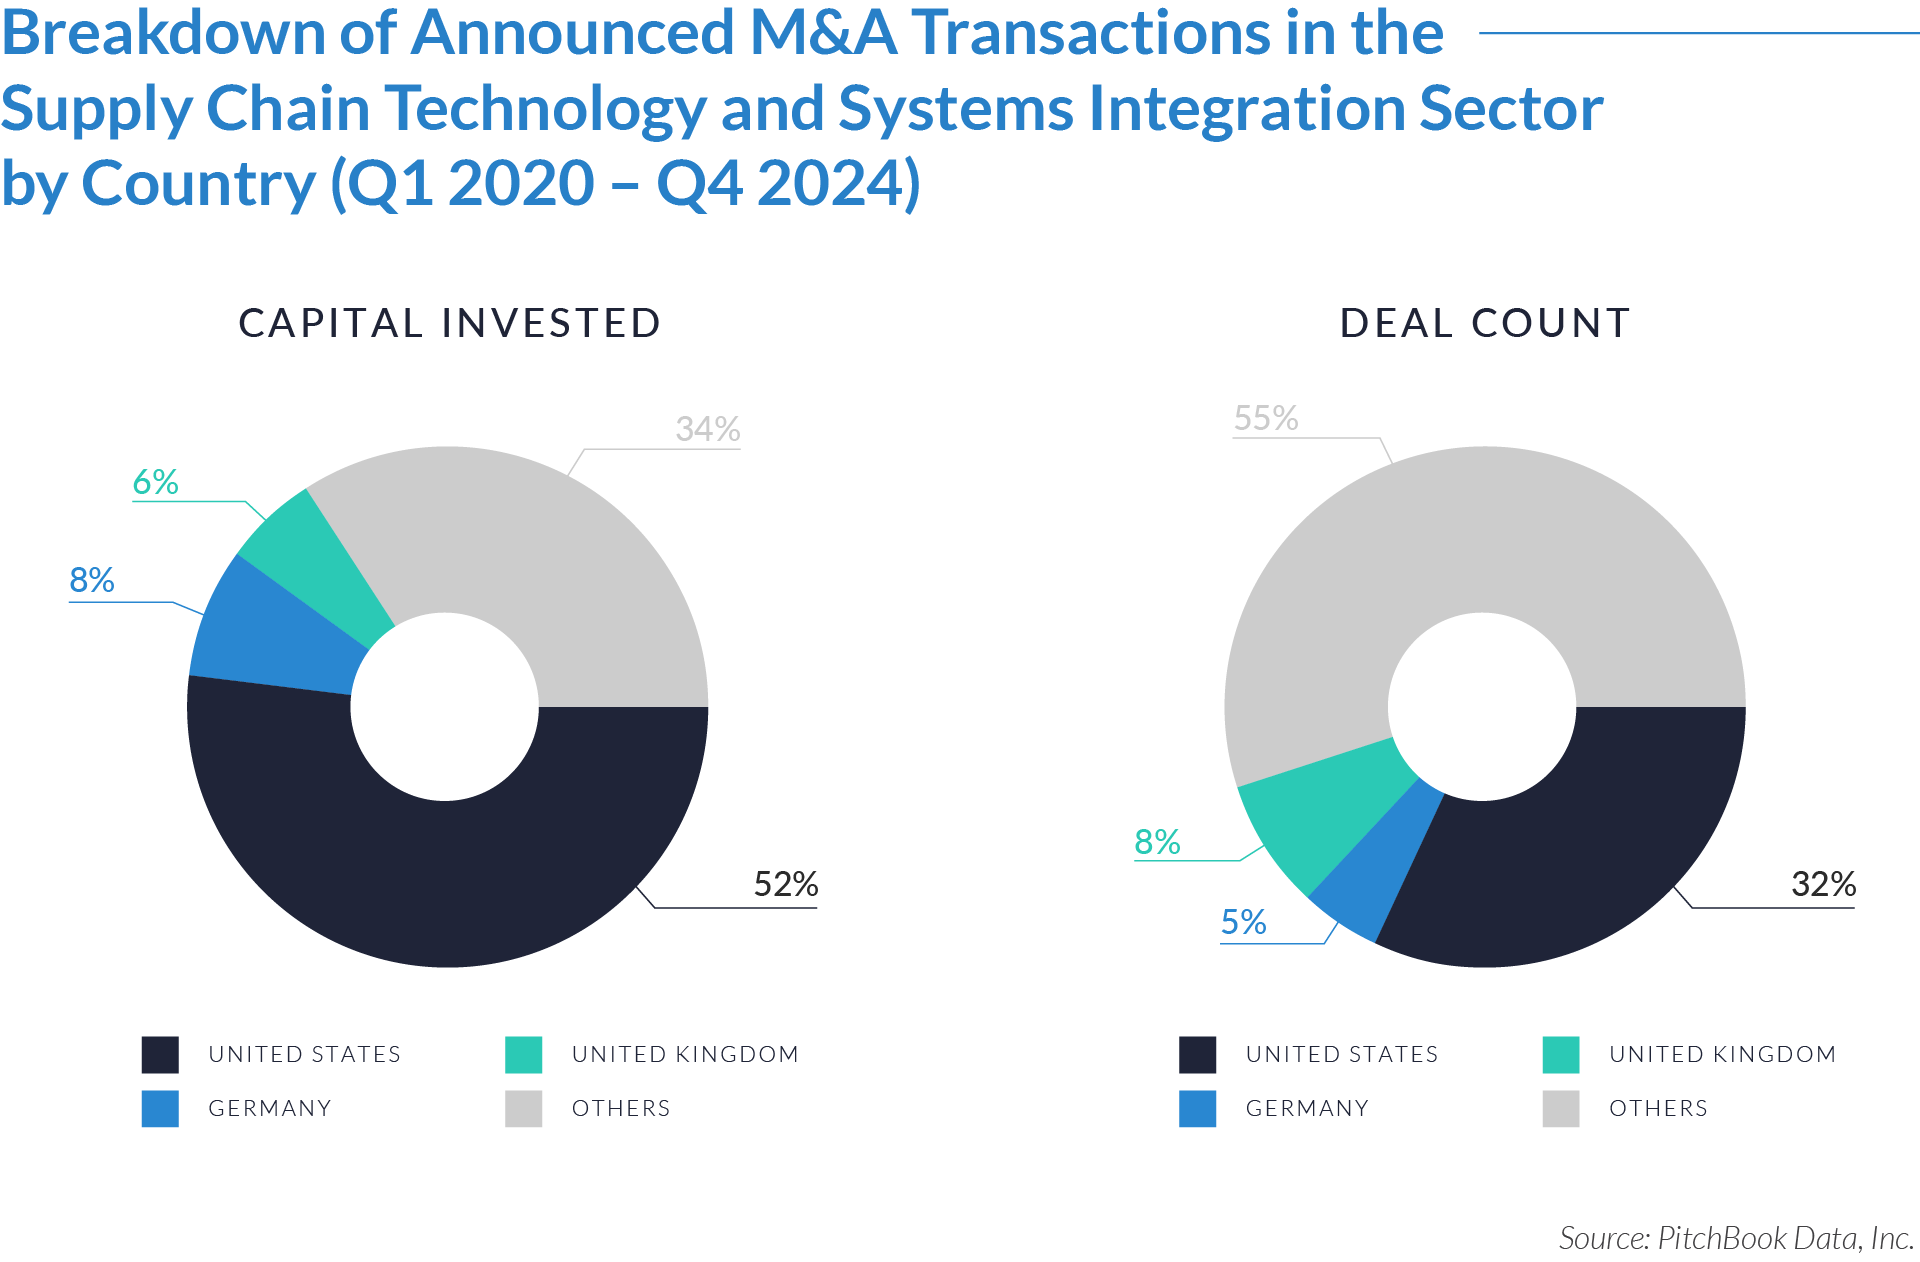
- US investors contributed 52% of total capital, making them the dominant funding source in the sector. However, they participated in only 32% of total deals, suggesting a preference for high-value investments rather than spreading capital across numerous smaller transactions. This approach indicates a focus on large-scale acquisitions, established supply chain technology firms, and strategic integrations that offer long-term competitive advantages.
- Emerging markets and international regions accounted for 34% of total capital but participated in 55% of all deals. This trend suggests that investors in these regions prioritized a higher volume of smaller transactions, likely targeting growth-stage companies, regional supply chain innovators, and scalable integration solutions. Their investment strategy reflects a focus on expanding technological capabilities, improving logistics efficiency, and strengthening infrastructure in developing markets.
- German investors provided 8% of total capital but participated in just 5% of deals, indicating a focus on fewer but high-impact transactions, possibly targeting market leaders or established firms with significant technological assets. In contrast, UK investors allocated 6% of total capital across 8% of deals, showing a broader, more diversified approach. This strategy suggests a balanced focus on both mid-sized and high-growth companies, aiming to scale supply chain technology and integration solutions across various sectors.
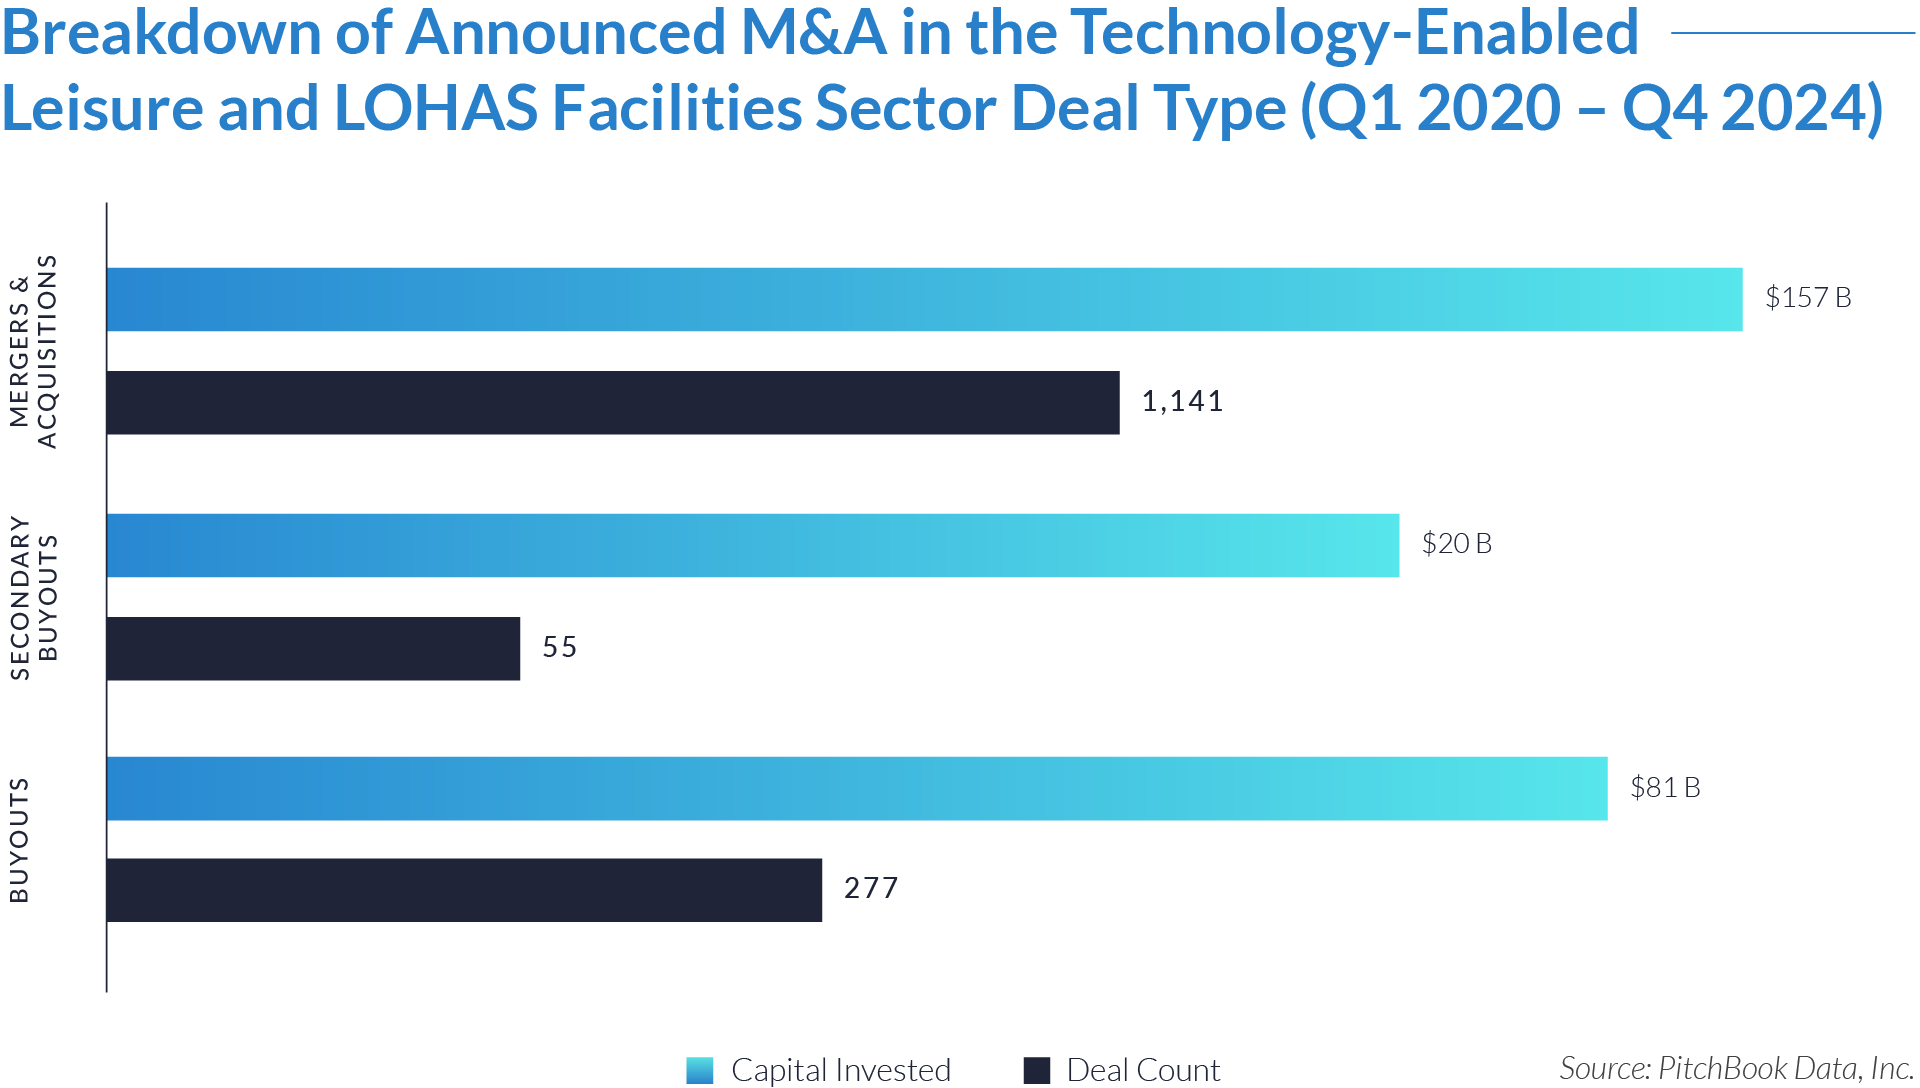
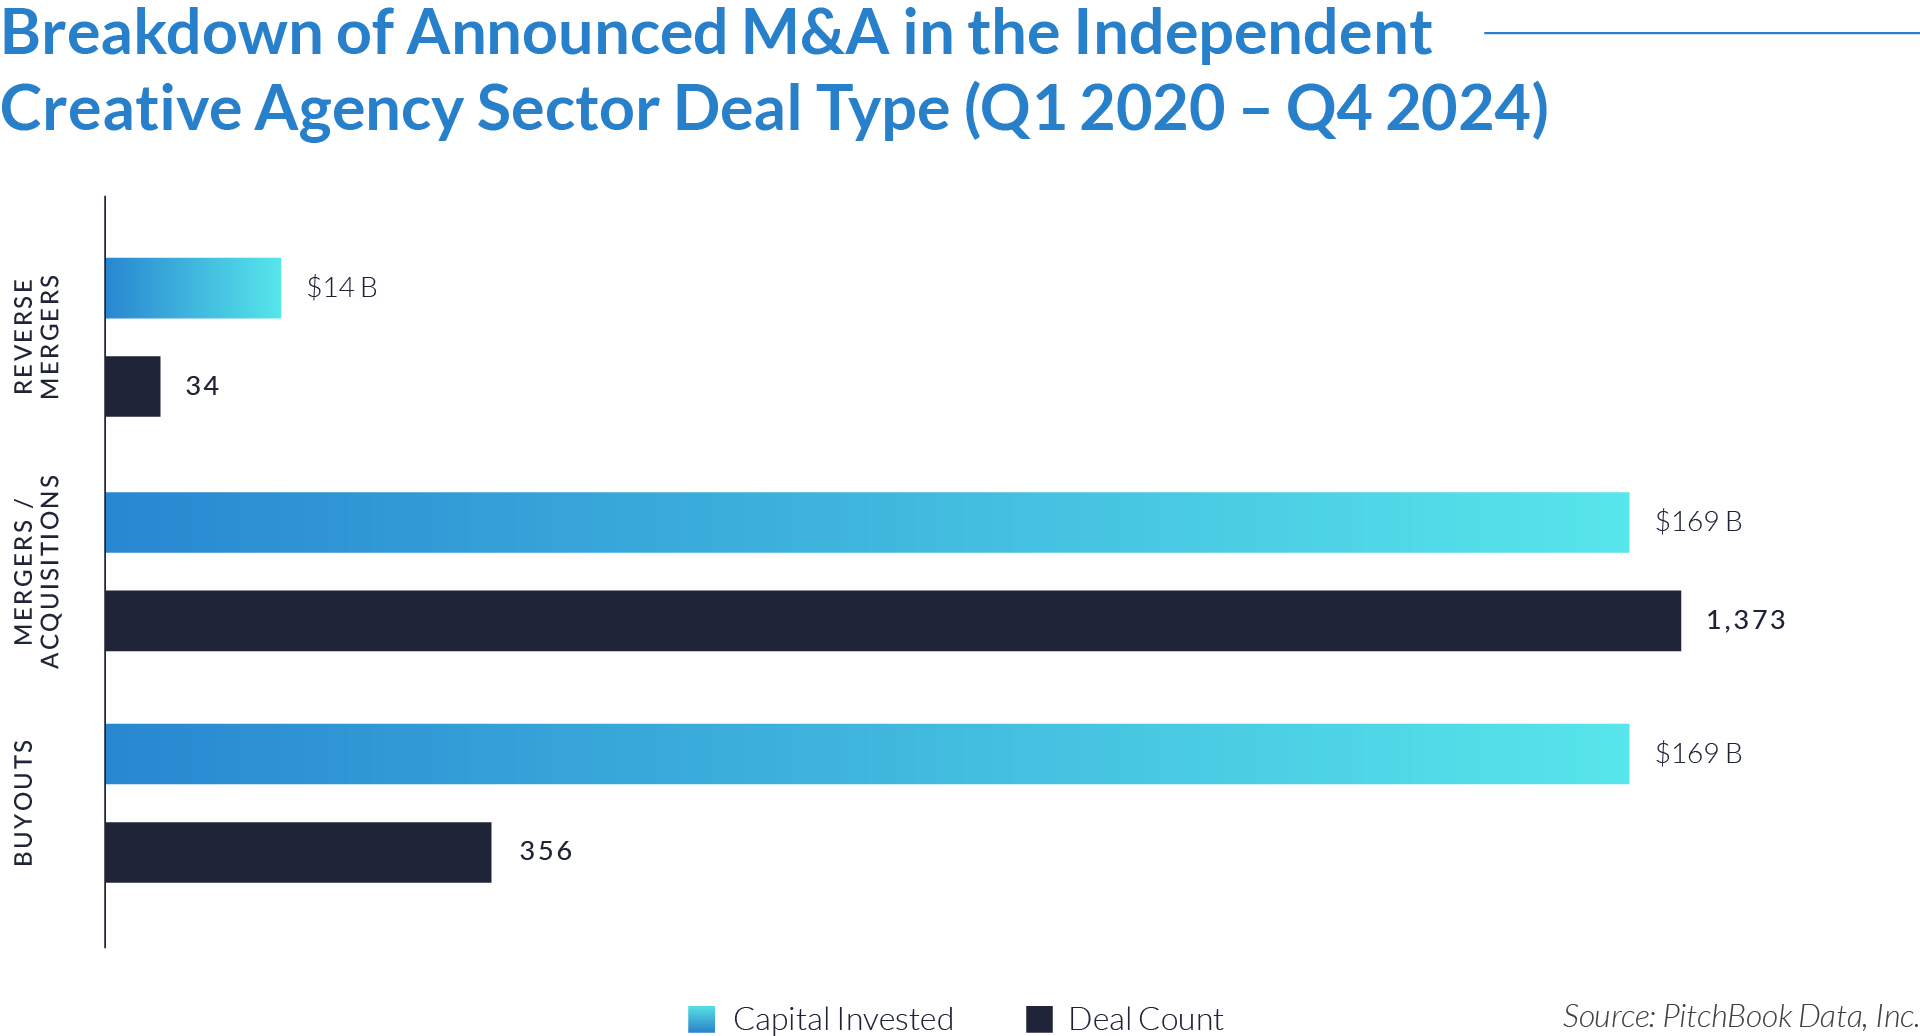
The deal-type dynamics below set the stage for understanding how capital flows and strategic priorities shape the supply chain technology and systems integration sector’s growth and landscape.
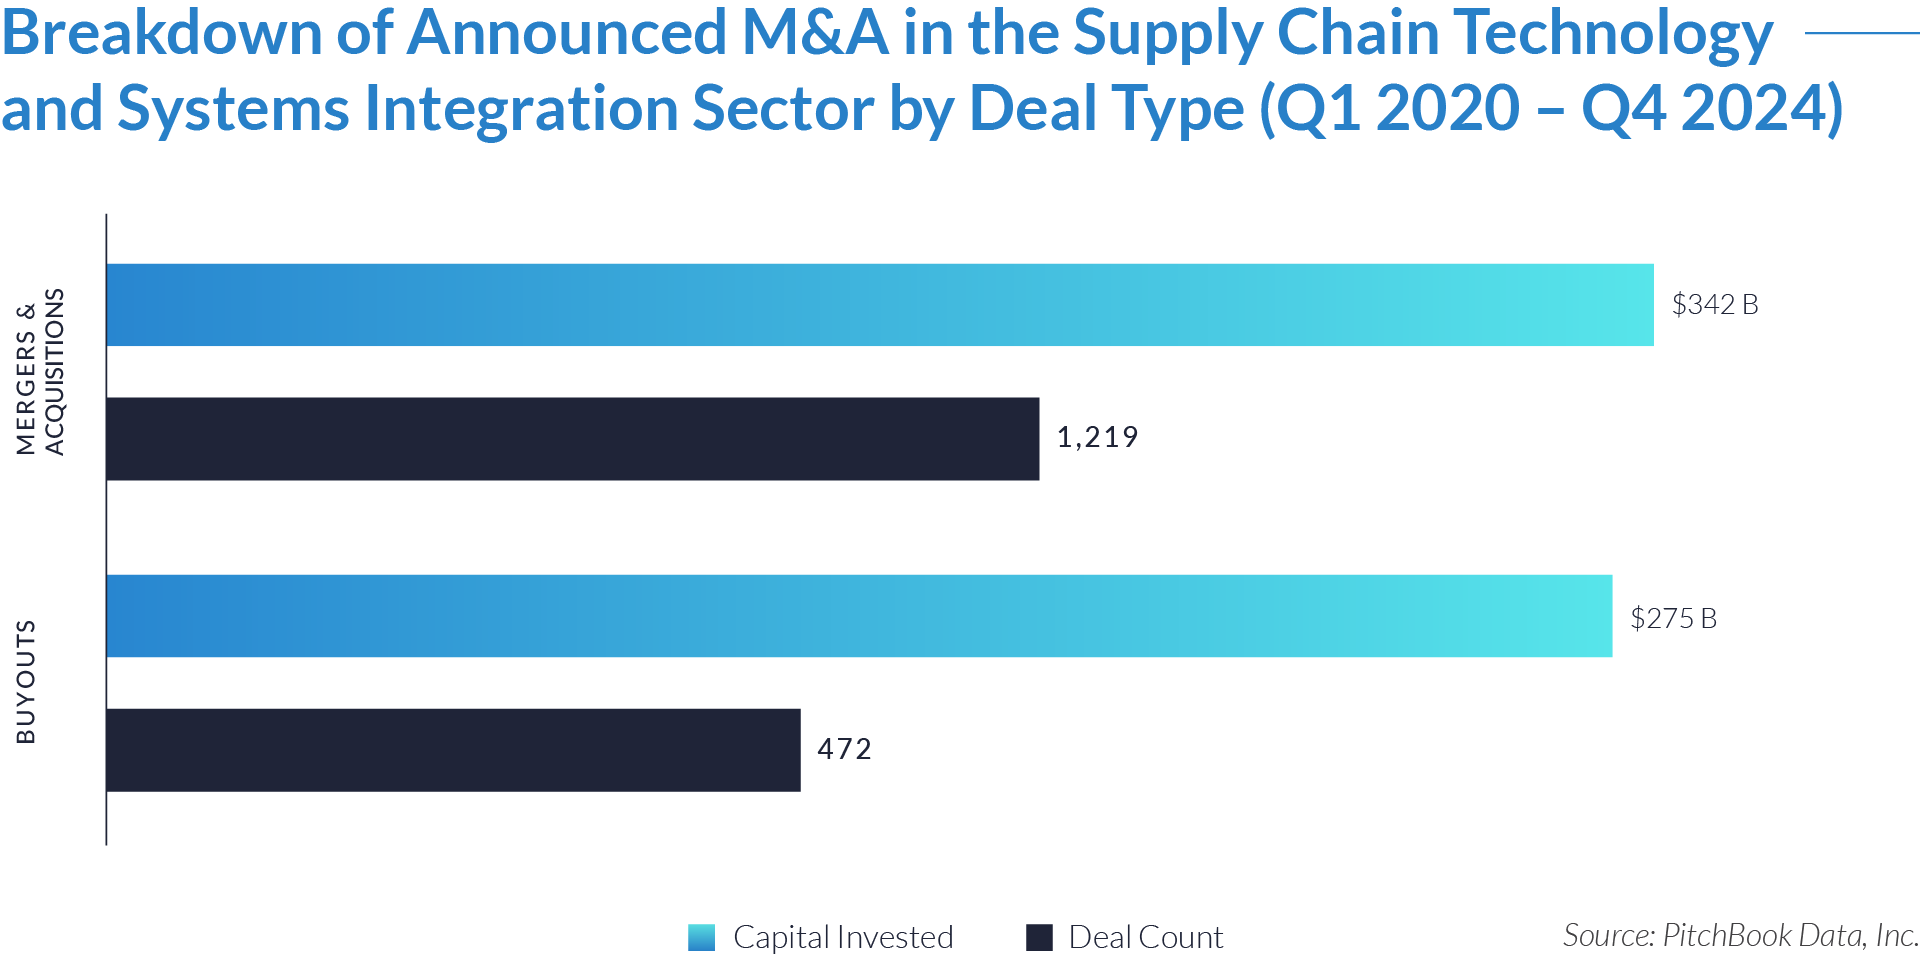
- Companies invested $342 billion across 1,219 M&A deals, representing 56% of total capital and 72% of all transactions. Industry leaders pursued acquisitions to expand capabilities, integrate new technologies, and strengthen their competitive edge in a rapidly evolving supply chain landscape.
- Private equity firms and institutional investors allocated $275 billion across 472 buyouts, targeting high-value, scalable companies with strong technological assets. Rather than spreading capital across numerous smaller transactions, they focused on selective investments that offered long-term growth potential.
- Investment strategies evolved with market conditions. M&A activity surged in 2021 as companies aggressively pursued growth, while 2023 and 2024 saw a shift toward buyouts, emphasizing cost efficiency and strategic consolidation. This balanced approach highlights investor confidence in both rapid expansion and long-term value creation.
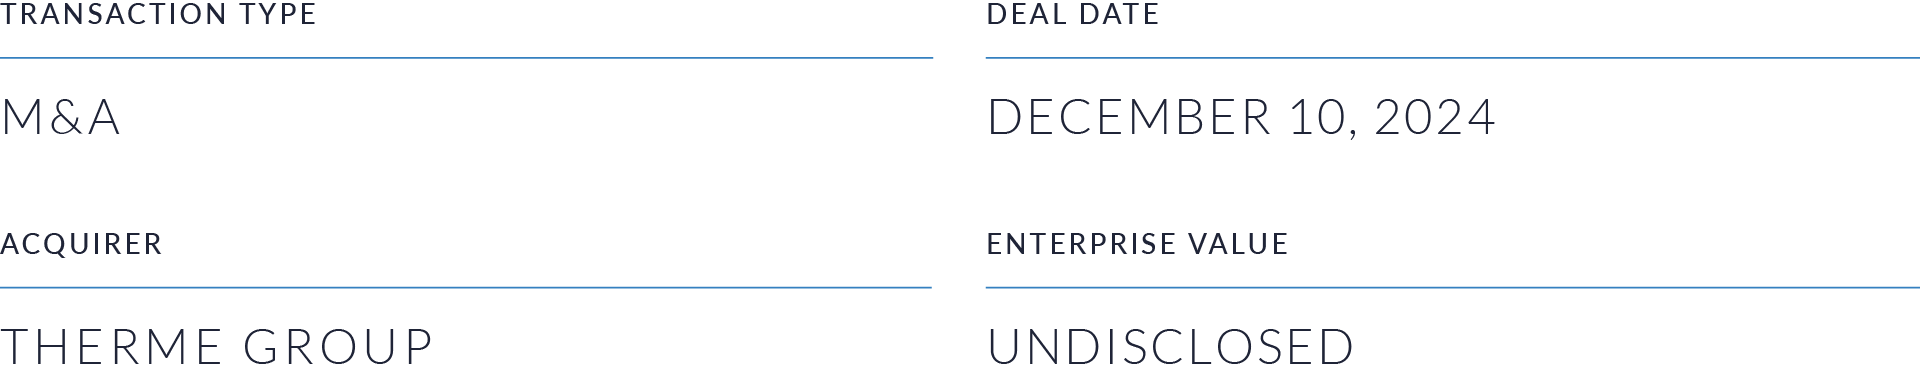
M&A Transactions Case Studies
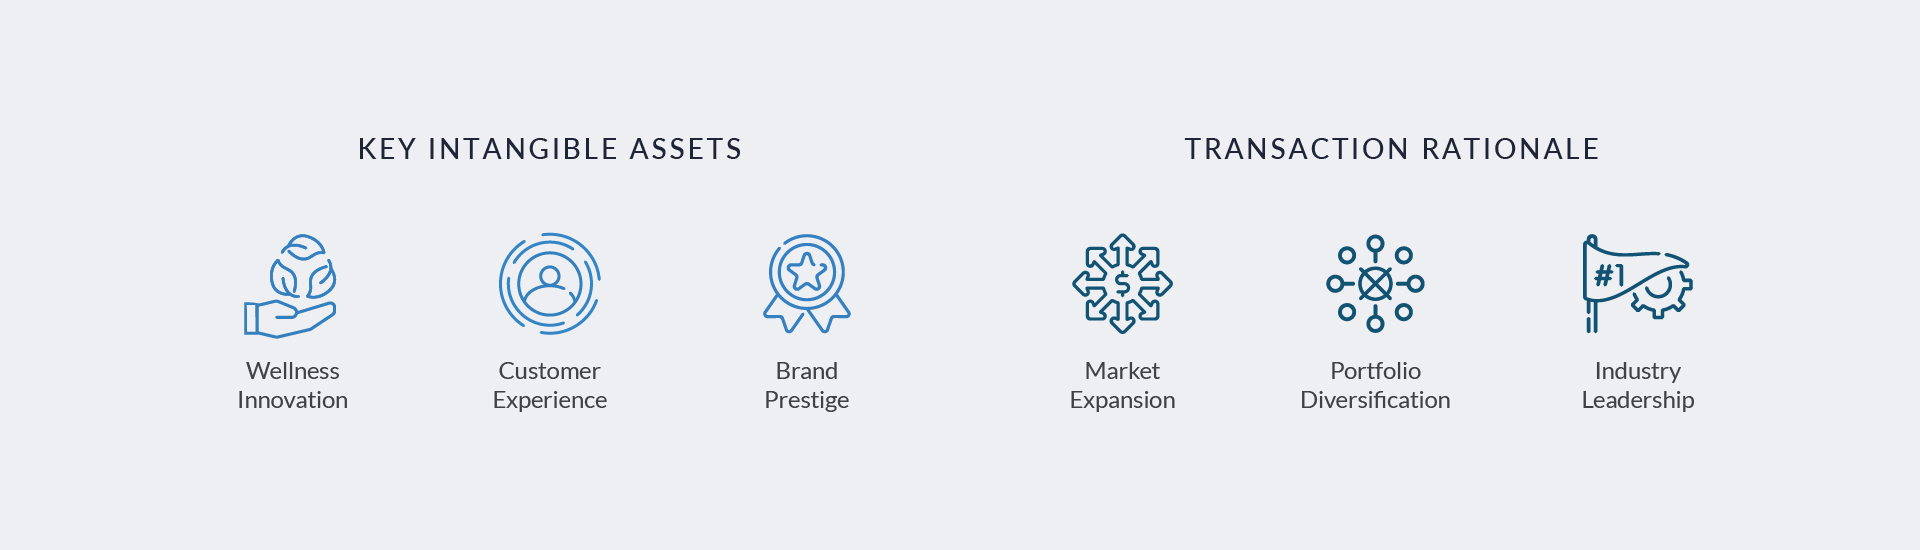
Three key acquisitions in the sector highlight a strategic shift toward technology-driven logistics, expanded geographic reach, and integrated supply chain solutions. These deals strengthened global trade infrastructure, improved operational efficiencies, and enhanced digital transformation efforts. Each acquisition underscores how investors prioritize 4PL capabilities, end-to-end supply chain visibility, and automation to meet evolving market demands.

Case Study 01
WINCANTON
Wincanton, a British non-asset-based logistics provider, specializes in 4PL, supply chain consulting, transportation management, and warehousing solutions. It serves diverse industries including retail, grocery, e-commerce, and defense, offering digital supply chain integration and managed logistics services. As a 4PL provider, Wincanton coordinates third-party logistics partners and leverages technology-driven solutions to streamline operations, enhance efficiency, and scale supply chain networks.

Transaction Structure
GXO Logistics, Inc. acquired Wincanton for $962 million, financing the deal through a $1 billion notes offering. The offering included $600 million in notes maturing in 2029 and $500 million in notes due in 2034, and closed on May 6, 2024.
Market and Customer Segments Combination
GXO Logistics’ acquisition of Wincanton expanded its service offerings in the UK and Ireland, strengthening its presence in retail, grocery, e-commerce, and industrial sectors. By integrating Wincanton’s 4PL expertise and digital supply chain solutions, GXO enhanced its ability to serve multinational corporations and regional enterprises with scalable, technology-driven logistics services. The combination created a more flexible and efficient logistics network, improving end-to-end supply chain visibility, operational efficiency, and market reach.
Acquisition Strategic Rationale
The acquisition reinforced GXO Logistics’ position as a global leader in contract logistics and supply chain optimization. By acquiring Wincanton, GXO broadened its 4PL and logistics outsourcing capabilities, offering comprehensive supply chain solutions to a wider customer base. The deal also accelerated GXO’s digital transformation efforts, integrating Wincanton’s technology-driven logistics operations to enhance automation, efficiency, and scalability. Additionally, the acquisition strengthened GXO’s competitive edge in the European logistics market driving cost synergies, operational improvements, and expanded service capabilities.

Case Study 02
NOATUM LOGISTICS
Noatum Logistics, based in Spain, is a global, non-asset-based logistics provider offering 4PL services, freight management, contract logistics, customs brokerage, e-commerce logistics, and project cargo solutions. With a presence in 25 countries and 97 locations, the company delivers comprehensive supply chain solutions, utilizing digital transformation and real-time visibility tools to streamline operations and enhance efficiency.

Transaction Structure
AD Ports Group, a subsidiary of Abu Dhabi Ports Group, acquired Noatum Logistics in a $720 million transaction, fully financed through a newly secured acquisition loan.
Market and Customer Segments Combination
The acquisition integrated AD Ports Group’s maritime and logistics infrastructure with Noatum’s global 4PL expertise, expanding its international reach. Noatum’s strong presence in Europe, the Americas, and Asia complemented AD Ports Group’s network in the Middle East and Africa, creating a more extensive logistics footprint. This synergy enabled the combined entity to serve a diverse customer base, including multinational corporations, e-commerce businesses, and industrial manufacturers, with enhanced logistics solutions, integrated technology, and expanded trade routes.
Acquisition Strategic Rationale
AD Ports Group acquired Noatum Logistics as part of its strategy to become a global trade and logistics powerhouse. By integrating Noatum’s 4PL expertise, digital capabilities, and international footprint, AD Ports Group enhanced its supply chain services, freight forwarding, and customs brokerage offerings. The deal also accelerated technological advancements, aligning with AD Ports Group’s vision of smart, efficient, and seamless global trade connectivity. Additionally, the acquisition improved operational efficiencies, created cross-selling opportunities, and expanded geographic reach, further strengthening the group’s position in global logistics and supply chain management.

Case Study 03
LI & FUNG
Li & Fung, a Hong Kong-based global supply chain management company, specializes in sourcing, logistics, and digital supply chain solutions. It connects brands and retailers with manufacturers, streamlining production, procurement, and distribution. By leveraging technology, data analytics, and automation, Li & Fung enhances supply chain efficiency, transparency, and responsiveness. As a 4PL provider, it orchestrates complex supply chains without owning physical assets, prioritizing agility, innovation, and adaptability to meet evolving market demands.

Transaction Structure
GLP acquired Li & Fung in a $930 million public-to-private leveraged buyout. As part of the transaction, GLP secured 40% of the voting shares and full ownership of the non-voting shares, resulting in an effective economic stake of 68%.
Market and Customer Segments Combination
GLP’s acquisition of Li & Fung integrated supply chain management with logistics infrastructure, creating synergies between sourcing, digital supply chain solutions, and 4PL services. Li & Fung’s expertise complemented GLP’s strengths in warehousing, logistics real estate, and supply chain financing, broadening their service capabilities. This combination expanded access to global brands, retailers, e-commerce companies, and manufacturers, providing end-to-end supply chain visibility and efficiency. The integration also enhanced market reach, particularly in emerging markets and omnichannel distribution networks, strengthening its competitive edge.
Acquisition Strategic Rationale
GLP pursued this acquisition to enhance its supply chain and logistics capabilities by integrating Li & Fung’s sourcing expertise and digital transformation initiatives. As consumer demands evolved and e-commerce, automation, and sustainability gained momentum, the deal accelerated innovation, optimized operations, and expanded market reach. By leveraging big data, AI-driven analytics, and digital supply chain solutions, GLP built a more resilient, technology-driven global supply chain ecosystem, unlocking long-term growth opportunities.

The supply chain technology and systems integration sector continues to evolve through strategic M&A, digital transformation, and investment in end-to-end automation. As companies prioritize efficiency, scalability, and real-time visibility, consolidation and technological advancements will accelerate. Investors remain focused on high-value, tech-driven supply chain solutions, shaping a future where AI, predictive analytics, and seamless integration enhance global trade, operational resilience, and supply chain optimization.
Source: Yahoo Finance, GXO, Mingtiandi (1), (2), Noatum, Seatrade, Pitchbook Data.